 RADIO
RADIO
A Better Projection
Anyone who plays fantasy sports needs simple answers to simple questions:
- Which player should I start or sit?
- Which player should I pickup and drop?
- Which player will be better tonight, next week, and next month?
Today, most fantasy users receive inadequate answers to these questions, driven by groupthink or gutshots. Projections try to answer these questions, but most projections are black boxes, number-heavy and ultimately too untrustworthy for wide adoption.
RotoBaller Matchup Ratings
Our Matchup Ratings simplify projections, and make them accessible to the average fantasy player:
- A single number, our Matchup Rating provides users with easy decision points for sit/start or add/drop decisions
- Daily, weekly, monthly and seasonal Matchup Ratings for every NFL and MLB player
- Built into our wavier wire and sit/start tools, Matchup Ratings are delivered where and when users need them most
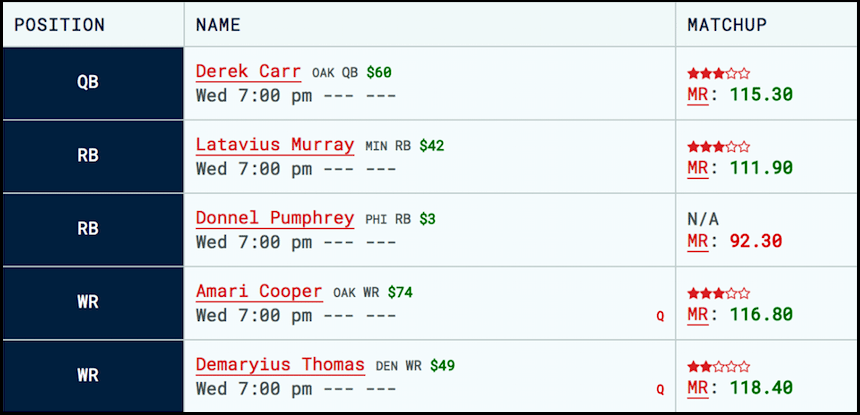
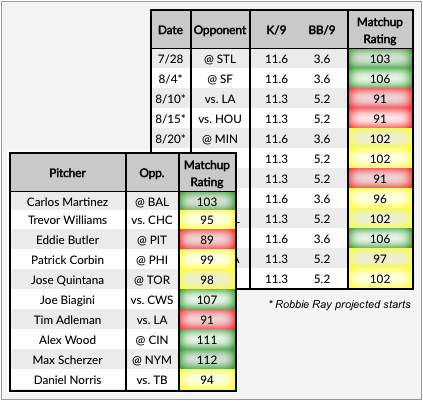
Site Integrations
Our Matchup Ratings integrate with various pages on other fantasy platforms like Ottoneu. The data format and parameters are flexible, making for an easy integration. Here are two examples, using colors, numbers, and star ratings to show different formatting options.
A Brief History...
The problem: most projections aren't very useful
The most common projections these days are detailed multi-statistic projections. How valuable is it that Devonta Freeman is projected to have 0.6 TDs, 76.5 yards, 4.3 targets, .08 fumbles, 3.2 receptions, etc?
It's tough for a user to make sense of detailed statistics like that, let alone a handful of them. Projections like these are too granular, and they fail to understand the fundamental needs of fantasy players.
How do Matchup Ratings solve this problem?
Matchup ratings are intuitive for a user. They present a single number, scaled around an average of 100, where 110 is 10% better than average and 90 is 10% worse than average.
Is a Matchup Rating still a projection?
Matchup Ratings are driven by the same core factors that drive projections. They are built with data science and are improving every month as we enhance our methodology with new variables.

The Data
How are Matchup Ratings calculated?
We look for the most important real-world factors that drive fantasy points. For example, a wide receiver's targets, the quality of their QB and O-line, their yards per catch and after catch, and much more.
Our obsession with sports data and improving our analysis has let us unearth some analytic gems. For example, opposing defense metrics (measured by yards allowed overall, and yards allowed vs. pass/run) had nearly zero correlation with fantasy points scored by QB, RB, or WR/TE.
We're continuing to research and factor in new variables for NFL and MLB and have a lengthy list of hypotheses to test.
What is data science and how is it being used?
Data scientists use scientific methods, processes and systems to extract insights from data. We're working with data scientists who've built complex real-time financial prediction models. Their algorithms look at decades of market data for specific asset classes and make buying/selling recommendations based on what the model says.
In this instance, for NFL, we've pumped the full data from the 2014-2016 NFL seasons into our database to test a multitude of variables, and then optimally weight them to come up with our Matchup Rating.
- We used an optimal percentage of the NFL season to "train" our model and establish a baseline of expectations with a huge sample of player-games.
- We used the rest of the NFL season to test the model we trained and variations of the model to see how well they perform.
- We measure the correlations and the p-value of every variable and combination of variables.
- In all our tests the correlations were statistically significant, and the p-values were very small, which indicates the results were not random.
How are different variables combined together in the formula?
Since our Matchup Rating is scaled around 100, all our component variables must be as well. First we verify that the stats are normally distributed, and then we scale them around 100 so that every stat is "speaking the same language". We then pump the variables through our model, apply the optimal weight to each stat, and finally average them together.
User Adoption
How have matchup ratings been received?
Users on RotoBaller love them. They provide users a single number with which to make a sit/start decision or an add/drop decision. It's easy and quick, and though it's complex behind the scenes, it's intuitive for a user simple to a user. Our Matchup Ratings based tools are our most heavily used tools on RotoBaller and drive our recurring subscriptions.
The Future
What does the future look like?
In today's app world, everyone wants faster, on-demand, personalized services. If a service isn't intuitive, and value can't be provided quickly enough, it won't catch on. Such has been the case with most projections in fantasy sports.
Fantasy managers want advice tailored to their teams, in a digestible format, delivered exactly when they need it. The majority of fantasy players are casual, and they either don't know how to find the info they need, or they don't want to work too hard to find it.
Matchup Ratings are the projections of the future. They were made for all types of users, and especially the casual ones.
What does the future of Matchup Ratings look like?
The future holds continued improvement and more accurate Matchup Ratings. Since starting this project in June 2016, we have already improved our accuracy by 10%.
We have a long development queue with prioritized hypotheses that we are testing for baseball and football. With each new release, we improve the Matchup Rating and share the new correlations with our partners and users so everyone can see the progress being made.


