We're officially past mid-season and if that doesn't make you sad enough, how about the fact that even the trade deadline has past us now? Eh? Was that what ultimately broke your hopes of football staying on forever? Too bad. The good news, as always, is that a new week full of games is ahead. And most importantly for us (and me, who writes this) is that another week is in the books and we're ready to crunch some more data!
To gain the biggest edge in your fantasy football league, it's necessary to understand how to apply the advanced statistics being used in every sport nowadays. Back in the day, it was all about wins and losses, passing yards, and touchdowns scored. It's not that those stats are now worthless, but they don't offer enough information to savvy analysts. While football is still in its infancy compared to baseball in terms of analytics, the evolution the sport has seen lately in those terms is notable.
Each week, I'll be tackling NFL's Next Gen Stats, bringing you data from the just-completed week's games with notable takeaways you should consider when assessing fantasy players for the upcoming week. In case you're new to the series, or Next Gen Stats altogether, I recommend you read our preseason primer. Now, let's get to the data!
Featured Promo: Get any full-season NFL Premium Pass for 50% off and win big in 2022. Exclusive access to our Premium articles, 15 lineup tools, new Team Sync platform, Lineup Optimizer, Premium DFS tools and cheat sheets, and much more! Sign Up Now!
We Studied RBs And QBs, But Where Should We Look When Analyzing WRs?
It has been a blast writing this column weekly, but the best feedback came from those who read the correlation studies of both running back and quarterback NextGen Statistics to fantasy scores. It makes sense to close the circle by getting back to wide receivers and tight ends in the same way I did for the other two prime positions in fantasy football.
When I tackled receivers back in Week 5, I focused first on two metrics related to space: Average Cushion (CUSH), which measures the distance between the WR/TE and the defender covering him at the time of the snap; and Average Separation (SEP), which measures the distance between the WR/TE and the nearest defender at the time of the catch/incompletion.
I ran some formulas there and came up with graphics and calculations to compare the relationship between those two metrics with both Air Yards and Yards After Catch. All in all, there wasn't much to extract from it. That fostered the idea of building this three-part series around the correlation of stats and fantasy performances, and here we are today to close them out.
What I'll do here, as in the past two entries, is simple and is based on the fact that we can take interesting information from each and every metric available to us, but as we saw with running backs and quarterbacks, not every metric should be weighted the same when assessing players in our fantasy leagues. So I'm going to cut to the chase and provide the most meaningful information about the metrics available at NFL's Next Gen Stats WR/TE receiving leaderboard. That way, you will be able to know which metrics correlate more with WR/TE success and fantasy points.
Through eight weeks of games, there are 126 players qualified with at least 20 targets this season. Nobody has reached 100 yet, but that could change as soon as this weekend's end.
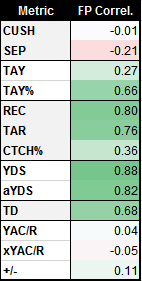
Firstly, I ran a few simple correlation calculations to see how metrics and fantasy points relate and how strong those relationships are. The resulting numbers range from negative-1 to positive-1. Zero means no correlation. A negative value means an inverse relationship (when one metric goes up, the other goes down), and a positive value means a direct relationship (when one metric goes up, the other goes up too). Here are the metrics offered by the NFL to measure WR/TE performance, and how they relate to Fantasy Points (notice how I've divided them into six related groups explored in detail later):

As a quick intro to correlation: Experts more or less agree on correlations being significant only if the value surpasses the +/-0.7 threshold. As you can see, only four metrics do that here and two of them are the most obvious and most related to fantasy points: receptions and yards (followed by targets and air yards). However, that doesn't mean the rest of the stats aren't important (in fact, anything around +/-0.5 shows a good enough relation to be taken seriously). They are still important but to a lesser degree, and should be taking into consideration when looking at WR/TE data. Sports are not an exact science, so it is impossible to have stats perfectly align week to week. It makes it harder for us fantasy owners to play the game, but it also makes it fun!
Instead of giving a quick takeaway of each metric, I'll do it in conjunction with the leaders and trailers of each category. This will allow you to pair the main takeaway from each stat with some real-life examples. I'll include the fantasy points of each player showcased to provide a better context for comparison.
"CUSH & SEP" Translated to Fantasy Football
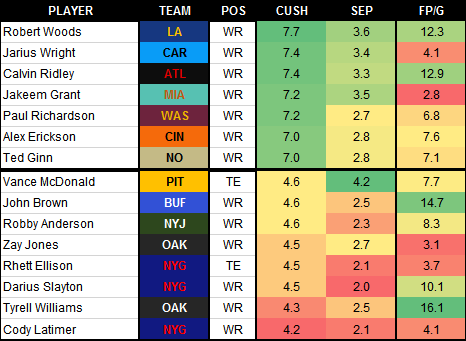
Leaders and trailers:

Impact on fantasy football points (CUSH negative-1% / SEP negative-21%):
- CUSH: Cushion has only to do with how much distance is given to a receiver by his main coverage man, and as it turns out, it has zero correlation with fantasy performance. Yes, it can affect yardage, the chance of the receiver at the point of the catch in short/quick throws, etc. but can be skipped when looking at who to add to our fantasy teams.
- SEP: Separation, on the other hand, has a low yet interesting negative correlation with fantasy points. The more a receiver can separate from his coverage, the better his chances of completing the reception as he won't be as pressured. However, this actually has a negative correlation (more separation equals fewer fantasy points) because WR/TEs that are left "free" are those who carry the less threatening skill set. Don't read too much into it, but if you are comparing two similar players and one gets much more separation than the other on average changes are the one with the bigger value is worse overall and thus covered less tightly.
Important takeaways:
- If anything, you'll find a slight correlation between both CUSH and SEP themselves, but not any other statistics available at NGS or fantasy points. Those metrics talk about how different players are approached by defenses, the style of play they have, and some underlying abilities, but not much else.
"TAY & TAY%" Translated to Fantasy Football
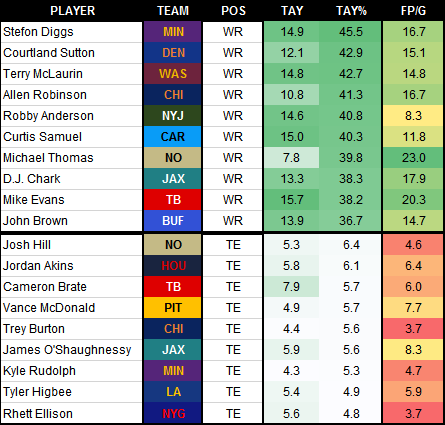
Leaders and trailers:

Impact on fantasy football points (TAY 27% / TAY% 66%):
- TAY: The average targeted air yards a player amasses can help in making a mental profile of the player we're analyzing. Those with high values are players who are often targeted down the field, and thus deep threats. There is not a great correlation between that and fantasy points, but the little one (27%) that exists is logical given that deep threats can rack up more yards on completion and ultimately score more fantasy points.
- TAY%: This refers to the share of the total team's air yards a player gets, so the correlation with fantasy points here is high and obvious. If any player is eating up to more than 25% of his team's air yards, that means he's getting at least one-quarter of the potential yards/points to himself alone. Considering an offense features three receivers and a tight end on average, that is the theoretical top value of air yards any player should see, so those exceeding it are clear go-to guys in their attacks.
Important takeaways:
- The share of a team's air yards a player gets doesn't have quite a strong relationship with fantasy points as other metrics presented here (normal, considering this is not a metric that translates into points as is), but is one of the most important ones when assessing receivers.
- Every WR/TE with a share of 40% of more is averaging 14-plus fantasy points per game.
- Of those with a share between 35% and 40%, six of nine are averaging 14-plus points.
- Of those with a share between 25% and 35%, 24 of 31 are averaging 10-plus points.
- Of those with a share under 15%, only 8 of 50 are averaging 10-plus points.
"REC & TAR & CTCH% & TD" Translated to Fantasy Football
Leaders and trailers:

Impact on fantasy football points (REC 80% / TAR 76% / CTCH% 36% / TD 68%):
- REC: I'm using FP/G in a PPR-format league here for the calculations, so the correlation is stronger than it'd be in other formats. Even with that, everybody should have expected this. If a receiver doesn't catch the ball he's not going to rack up yards and thus he won't get any points. As simple as it gets. And in PPR it comes with the extra bonus of being directly related to fantasy scoring.
- TAR: As I've always predicated and is worldly known by now, volume is key. Yes, receivers must catch the ball, but to have the chance of catching it they first have to be targeted by the quarterback and have the ball thrown their way. The targets a receiver gets is as important as any other metric out there.
- CTCH%: Not the strongest of relations, but still important. This metric works better when looked at next to the targets a receiver is getting each game. You probably don't care if a player has a low catch ratio so long as he's getting 15 targets per game, as the volume will make up for those buttery hands. But if you have someone with a low amount of opportunities paired with low catching ratios, that could be reason for concern.
- TD: This only has a strong relationship because touchdowns give the player in question a massive six points and therefore have massive effect on the receiver's total fantasy points. The problem with it, and why you shouldn't be locked into it, is that touchdowns are really low-volume and volatile, and therefore not a reliable path to success in fantasy football.
Important takeaways:
- Keeping the touchdown talk up, just look at the table. Tyler Boyd is the third-most targeted player yet he only has one score. Travis Kelce is the most-targeted tight end and has two, while Zach Ertz has one touchdown on one fewer target than Kelce. On the other hand, Zach Pascal has seen just 21 targets and has three touchdowns to his name already. Not. Reliable.
- Through eight games, every player targeted at least 45 times so far is averaging 9-plus points per game. Those with 55-plus targets are averaging 10-plus points.
- At the other end of the spectrum, among 38 players targeted under 30 times only five are averaging more than 10 points per game (Hunter Henry, Tyreek Hill, Will Dissly, Taylor Gabriel, and Darius Slayton).
"YDS & aYDS" Translated to Fantasy Football
Leaders and trailers:

Impact on fantasy football points (YDS 88% / aYDS 82%):
- YDS: No matter the format you play -- PPR, half, or standard -- a yard is a yard and it counts the same in most every league. Yards mean points. That is why they have the highest relationship to fantasy points, at a staggering 88%. But what makes yards possible? Targets and receptions. Consider yards as the be-all and end-all of fantasy production for receivers, but keep in mind they are only there because of what happens before they can be amassed (a player being targeted, and ultimately catching the ball).
- aYDS: As you can see, air yards are almost as valuable as overall yards. The 6% difference is explained by not-air yards, or yards after the catch (see the next section). So if you're debating between two players and one is much better than the other after the catch but has similar air yards, don't let that sway your opinion too much as it is not that important.
Important takeaways:
- There is only one player with 450-plus receiving yards failing to average more than 12 points per game: Jarvis Landry (11.6). On the other hand, only one player with under 200 yards this season has an average of 10-plus points: Taylor Gabriel (10.2).
"YAC/R & xYAC/R & +/-" Translated to Fantasy Football
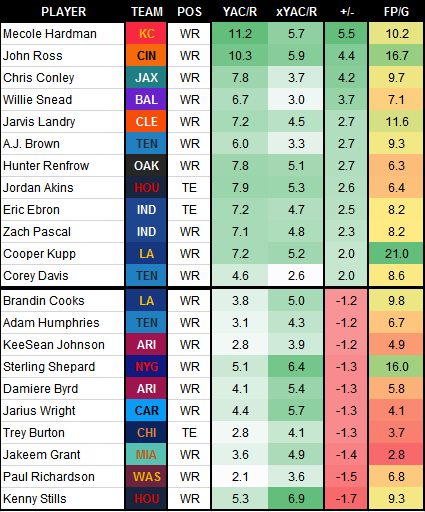
Leaders and trailers:

Impact on fantasy football points (YAC/R 4% / xYAC/R negative-5% / +/- 11%):
- YAC/R%: As introduced in the last section, yards after the catch by receivers aren't that meaningful for fantasy purposes. The largest part of a player's fantasy points come from the yards the ball flies from the quarterback to the receiver position when he catches it, and the rest is just a bonus.
- xYAC/R%: Any "expected" metric should be taken into consideration in fantasy, as it doesn't work in a "real" world that translates into what a player is averaging in fantasy terms, but the relation of xYAC/R and the actual YAC/R from a player is very similar, only inverse.
- +/-: The strongest of relationships from this group comes from the difference between what a player is doing and what he should have done, but even still this metric only explains 11% of a receiver's fantasy points in a positive way. That is logical, considering that players over-performing the gain of yards after the catch are going to be getting more points via extra-yards on their receptions. But again, this is a metric to discard.
Important takeaways:
- Only one player (Cooper Kupp) with 30-plus receptions this season is averaging more than 7.2 yards after the catch. That shows how hard is to keep that number hard and how big gains on the ground after catching a pass are just flukes in the long game.
- The largest YAC/R and xYAC/R are those belonging, as expected, to players with very few receptions: Mecole Hardman (11.2 YAC/R on 20 receptions), John Ross (10.3 on 16), Sammy Watkins (8.1 on 28), and Deebo Samuel (8.0 on 18).
- If you look at the table above, sorted by "+/-", you can see how little relation is between these three metrics and fantasy performance. Just taking a quick glance and focusing on the colors, you can differentiate every tone from green to red without trouble, which simply and ultimate means that there is not much to take from this group of stats.
That's it for today. Until we meet again next week, don't get too mad at the bye weeks, try to find the best free agents on your leagues' player pools, field the most productive teams you can, and win the weekend with all of your squads!
 RADIO
RADIO


