Launch angle is important. There is a sweet spot for launch angles and the hitters that hit the highest shares of their batted balls in those angles will have more success than the rest of the league. The reverse is also true. If you are consistently hitting the ball straight in the air or directly into the ground, your numbers are not going to be good. This visualization really sums it all up. This is the slugging percentage for every launch angle over the last two seasons.
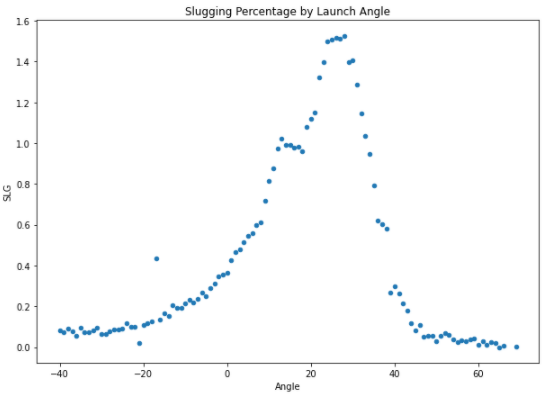
The best angle range to live in is clearly between 15 and 30, as all of those values give you a slugging percentage above 1.000. It could then be very revealing to find hitters that were in this range but began to slide out of it. So I took each hitters median launch angle from 2019 and compared it to their 2020 season and saw which hitters had the least favorable shifts.
Featured Promo: Want a free RotoBaller Premium Pass? Check out these sports betting promo offers from the top sportsbooks! All new sign-ups get a free bonus offer on their first deposit, and a free year of RotoBaller's Premium Pass for all sports ($450 value)! Sign Up Now!
Jorge Soler (OF, KC)

This is a rolling median plot. For every ball after the 100th ball put in play, I've calculated the median launch angle for the previous 100 balls in play. This shows the trend over time of each player's launch angles.
Everything clicked for Soler in 2019 as he blasted 48 homers in 162 games, slugging .569. That was no doubt aided by him getting a lot of balls into the sweet spot. The good news is that Soler's fly balls did not turn into grounders as much as they just turned into line drives. His ground-ball rate actually dropped from 39.3% to 37.8%, but he added 4% on to his line-drives. Line drives are great for batting average, but not the best for homers.
This plot does a good job to show Soler's shift:
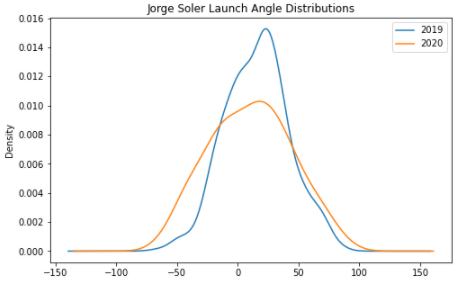
This plot displays the distributions of each player's launch angles, with launch angle being on the x-axis and the percent of the total on the y-axis.
You can see that he had a much higher share of launch angles between -50 and 0 in 2020 compared to 2019.
Despite that, Soler is not someone to be really worried about. He continued to hit the ball insanely hard in 2020, and his barrel rate actually came up. He remains a guy that projects to hit a good amount of homers while not providing much else; I don't think his decreased launch angle in 2020 is worrisome.
Austin Riley (3B/OF, ATL)
Riley hit nine homers in his first 18 big league games, and then 17 more in the following 113 games. His .239/.301/.415 slash line in 2020 leaves a ton to be desired. He posted a median launch angle of 21 degrees in 2019, but that fell to 16 in 2020. Here's the distribution comparison:

A much flatter curve there with angles spread out above and below the optimal range. His 2019 curve is almost exactly what you want to see, really concentrated around 10-30 degrees. The 2020 curve shows a very inconsistent hitter. No doubt, the league adjusted to Riley quickly and he has some work to do to be a consistently successful power hitter moving forward.
Aaron Judge (OF, NYY)

Judge's struggles with injury have resulted in him playing in just 130 games over the last two seasons. He got off to a roaring start in 2020 but sputtered to the finish line. Before his August 11th injury, he hit .290/.343/.758. After returning from that injury he slashed just .194/.326/.222 in his final 43 plate appearances. His launch angles were spread all over the place as well:

I'm willing to forgive Judge here and attribute the poor performance to injury, but of course, we cannot forget about the trouble he's had staying on the field moving forward. The true questions revolve around health, not raw ability.
Rhys Hoskins (1B, PHI)
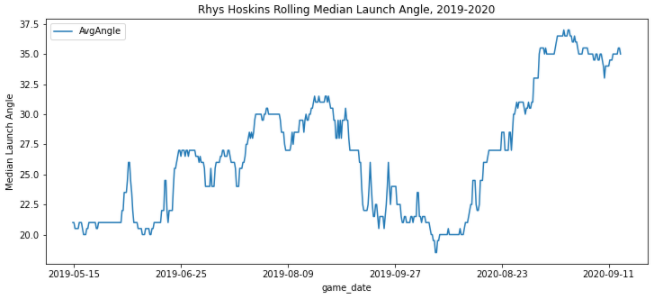
Hoskins actually had the opposite problem in 2020. While the rest of the guys saw their launch angles fall out of the optimal zone downwards, Hoskins exited that zone upwards. His median angle in 2019 was a very nice 23.5 degrees, but in 2020 that came up to 32 degrees. While 32 degrees is a good spot to be at, the fact that 32 is his median means half of his balls were hit above there, which is out of the optimal range. Here are the distributions:
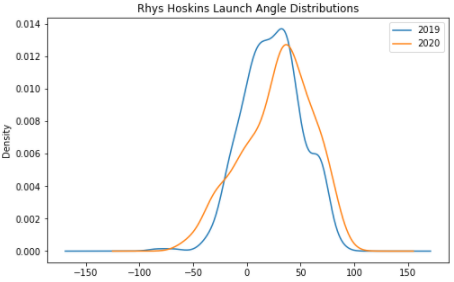
You're going to have trouble getting anything above 35 degrees out of the ballpark, and Hoskins hit a lot of balls above that angle. He also added on more balls hit directly into the ground, so it's not a very good look for Hoskins here.
Joey Gallo (OF, TEX)

Gallo has always been "home run or bust", but he took that to a new ridiculous level in his short 2020 season. He hit just .181/.301/.378, but still with a respectable 10 homers. His strikeout rate stayed ridiculously high (35%), but his walk rate fell (12.8%). He still kept the ball in the air but got it a little too far in the air quite a bit.
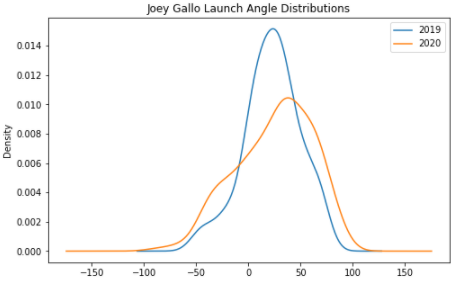
That is just way too many balls hit above 40 degrees. Gallo has been the barrel rate king in his career, with a career barrel rate of 21.4% (the league average is 6.1%). In 2020 he posted a 14% barrel rate, which is awful by his standards. If Gallo cannot bring his median angle down in 2021, it's going to be another just atrocious batting average season for him (we're talking sub .200 for a guy that strikes out this much).
Austin Meadows (OF, TB)

The Rays outfielder was on the field for just 36 games last year and struggled mightily with a .205/.296/.371 line. That had a lot to do with his constant pop-ups. His fly-ball rate came up to a career-high 53.6%, but lots of those fly-balls were just hit way too high in the air.
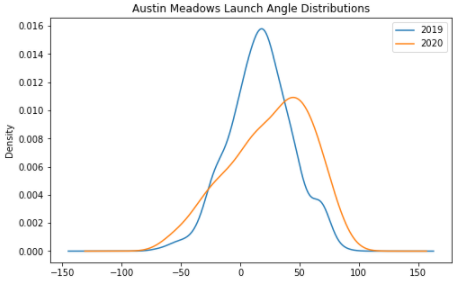
That's an impressive share of balls hit above 50 degrees, not a good sign. It probably has to do with the lack of timing he had given the strange season and his injuries, so I wouldn't read too much into the 152-plate appearance sample.
Michael Conforto (OF, NYM)
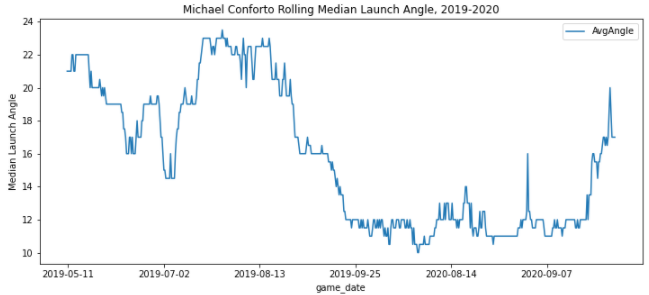
This is one of the biggest shifts we see. Conforto had his median angle comfortably above 20 degrees for most of 2019, but near the end and into 2020 it really fell off. His median angle in 2019 was 17 degrees and it fell to 14 degrees for 2020.
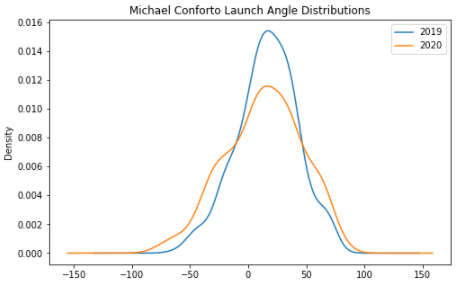
Conforto's line drive rate ballooned from 23.9% to 30.3% in 2020, while his fly-ball rate plummetted from 40% to 28%. That move is visualized nicely in the plot above. Conforto rode the increased line drive rate to a career-best .322 batting average, but his power production fell off in step (homered at a rate of below 25 homers per 162 games last season after hitting 33 homers in 2019). That gives us optimism that you can get tons of production from Conforto even without the ball leaving the yard, but it's not clear that he's a guy that can flirt with 40 homers anymore. Only time will tell.
Download Our Free News & Alerts Mobile App
Like what you see? Download our updated fantasy baseball app for iPhone and Android with 24x7 player news, injury alerts, sleepers, prospects & more. All free!

 RADIO
RADIO


