It's been a month since the last time we took a look at our beloved quarterbacks. Numbers are numbers, and numbers don't lie. You can twist them, but looking at them objectively, numbers say that no matter what, rushing the ball is almost always a worse option than passing it in today's game. That's why this column is the most important one you'll read today. It's time to tackle how quarterbacks have done through six weeks of play.
To gain the biggest edge in your fantasy football league, it's necessary to understand how to apply the advanced statistics being used in sports nowadays. Back in the day, it was all about wins and losses, passing yards, and touchdowns scored. It's not that those stats are now worthless, they just don't offer enough information to savvy analysts. While football is still in its infancy compared to baseball in terms of analytics, the evolution the sport has seen lately in those terms is notable.
Each week, I'll be tackling NFL's Next Gen Stats, bringing you data from the previous week's games with notable takeaways you should consider when assessing fantasy players for the upcoming week. In case you're new to the series, or Next Gen Stats altogether, I recommend you read our NGS-primer. Now, let's get to the data!
Editor's Note: Our incredible team of writers received five total writing awards and 13 award nominations by the Fantasy Sports Writers Association, tops in the industry! Congrats to all the award winners and nominees including Best NFL Series, MLB Series, NBA Writer, PGA Writer and Player Notes writer of the year. Be sure to follow their analysis, rankings and advice all year long, and win big with RotoBaller! Read More!
Week 6 - The State Of The Passing Game
One of the most important concepts to consider when analyzing players are Air Yards. The metrics around it are key to know who is really over-performing or under-performing among receivers and passers, but it doesn't have much to do with rushers.
Today, I'll present each of the stats from the NFL's advanced metrics site, its correlation with quarterback-fantasy points, and a list of leaders and trailers in each category along with some notes and takeaways on both the players' and the metrics' impact on fantasy football as a whole.
As we'll be discussing quarterbacks and their passing stats, I will reduce the fantasy points per game averages to just those related to passing. That means that I have removed the rushing/receiving fantasy points the qualifying quarterbacks have logged during the season. I've called this metric paFP/G, which is to say passing Fantasy Points per Game.
So let's dive in. Note: The cutoff is set at 45 pass attempts.
Time to Throw
Correlation with Passing Fantasy Points: 1%
Leaders and Trailers:
Leaderboard Notes:
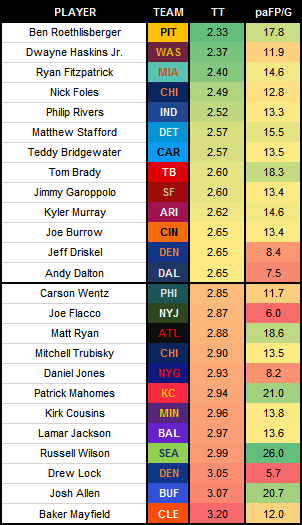
- When it comes to explaining fantasy points, there are few less predictive metrics than Time to Throw. The relationship sits at a measly 1% through more than a third of the season, just imagine...
- That's why things like this happen: no. 1 quickest TT (Ben Roethlisberger) is averaging 17.8 paFP/G... while no. 2 slowest (Josh Allen) is averaging virtually a similar 20.7 paFP/G.
- I find interesting the fact that most of the quickest TT belong to rookies/lowly-proved/boom-bust players (Dwayne Haskins Jr., Ryan Fitzpatrick, Nick Foles, Teddy Bridgewater,...) and those slowest to veteran/established/proved players (Josh Allen, Russell Wilson, Lamar Jackson, Kirk Cousins, Patrick Mahomes, Matt Ryan,...)
- Three of four players with a TT below 2.5 seconds were either benched (Haskins), started the season as the reserve (Foles), or will be benched next game (Fitzpatrick).
- On the other hand, all but one (Mitchell Trubisky) of the 21-slowest QBs in TT (all taking 2.7+ seconds to throw) have not been benched for a backup (some, like Drew Lock or Sam Darnold, were only benched due to injuries).
- Through six weeks, there are six QBs averaging 20+ paFP/G, and their TT marks are spread all over the spectrum, ranging from 2.67 (Ryan Tannehill) to 3.07 (Josh Allen).
- Something similar happens at the bottom of the paFP/G leaderboard: of the eight QBs averaging below 10 paFP/G so far, the TT numbers range from 2.65 (Jeff Driskel and Andy Dalton) to 3.05 (Drew Lock).
- As expected, the longer a QB takes to throw, the more yardage he tends to rack up as routes have more time to develop. The relationship between TT and CAY and IAY is up to 49% and 44% respectively through W6.
- On the other hand, there is a negative-46% relationship between TT and expected COMP% so far this year. The longer a quarterback takes to throw his passes, the lower the expectation is he completes them (makes sense, assuming "slower" passes are harder to complete as they tend to go for more yards downfield).
- All things considered, don't put much weight on this metric, as it is way more descriptive of past performance than predictive of future ones.
Completed/Intended Air Yards & Air Yards Differential
Correlation with Passing Fantasy Points: 34% / 0% / 36%
Leaders and Trailers:
Leaderboard Notes:
- While there is a rather high relationship between Completed Air Yards and paFP/G, there is zero relation between Intended Air Yards and paFP/G. That is rather surprising, and will probably vary through the rest of the season, but interesting nonetheless with more than a third of the year in the rearview mirror already.
- Take CAY and IAY for what they are. In fantasy leagues, what amounts to points are the things that happen on the field (CAY), not what players want to happen (IAY).
- Although Ryan Tannehill IAY is just 7.6 yards, his CAY is at 7.2 yards, which means he has the smallest difference between both values (AYD) at just -0.3 yards. He might not be throwing the most explosive bombs downfield, but he's doing what he's attempting to to perfection.
- Nick Mullens and Drew Brees are the only other quarterbacks with an AYD over -1.0 yards. The difference with Tannehill, though, is that they're averaging over one fewer air yard per attempt (6.5 and 6.1 IAY respectively), making their high AYD marks much easier to reach.
- Drew Lock has been as wild as it gets. His AYD of -6.0 leads all qualified quarterbacks by a mile, with Flacco having the second smallest mark (-4.9), already more than a yard over Lock's value. No other quarterback is below -3.5 (Mitchell Trubisky) AYD.
- Oh, by the way, try to find the similarities between those three (solution: all of them are bench-fodder).
- Both Denver Broncos quarterbacks with min. 45 attempts (Lock and Driskel) have the two largest CAY+IAY combined marks at 19.8 and 18.5 yards respectively. Kirk Cousins is third with 18.2. The problem for the two Broncos is that none they're just completing 6.9 and 8.0 CAY compared to Cousins' league-leading 8.4.
- Don't believe the lack of relationship between IAY and paFP/G? Well, Drew Lock has the highest IAY mark so far (12.9) while averaging the fewer paFP/G (5.7). Then, Andy Dalton has the second-lowest IAY (6.1), and is averaging the third-lowest 7.5 paFP/G... Similar outcomes, wildly distant IAY marks.
- Same at the top of the paFP/G leaderboard: Aaron Rodgers (9.3 IAY) is averaging 20.6 paFP/G while Derek Carr is at a virtually similar 19.9 paFP/G average with a rather low 7.1 IAY (10th-lowest among 38 qualified QBs).
- When it comes to the relationship between CAY and paFP/G, though, things are a little better. Of QBs with 20+ paFP/G on the season, their average CAY sits at 6.8. Of QBs with fewer than 10 paFP/G so far, their average CAY is at 5.6, more than a yard lower.
- Complete more passes for more yardage, and reap the rewards. As simple as that, I guess.
Aggressiveness
Correlation with Passing Fantasy Points: negative-19%
Leaders and Trailers:
Leaderboard Notes:
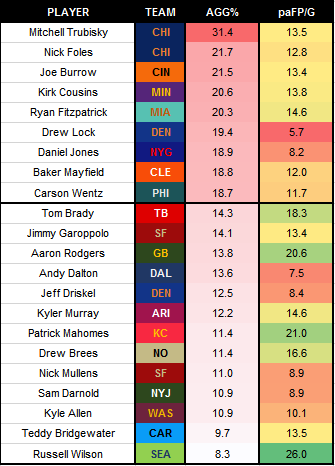
- We define "Aggressiveness" as the percentage of passes a quarterback throws into tight coverage, that is, when a defender is within 1 yard or less of the receiver at the point of the catch/interception. Don't take this metric as a sign of "braveness" or anything like that, though. It relates more to reckless-passing than anything else.
- A quick peek at the most aggressive passers gives you an idea of what we're dealing with here: Trubisky has been benched already, Foles replaced him, Fitzpatrick is insane (and will the bench next Miami's game), Jones has yet to prove his worth (which is growing smaller by the day), Haskins is on the trade list, and Joe Burrow has been forced to risk the biscuit on a weekly basis...
- There is just a negative-19% relationship between AGG% and paFP/G, but it's rather funny to find the top-five most aggressive players averaging paFP/G inside a tiny 1.8-clip ranging from 12.8 (Foles) to 14.6 (Fitz).
- Don't get it wrong or for what it's not. Of the seven least-aggressive players (all below 12.0 AGG%) the paFP/G range from a putrid 8.9 (Mullens and Darnold) up to the league-leading 26.0 (Russell Wilson).
- Joe Burrow already led the league in aggressive attempts back in Week 3. He's still leading by a lot through Week 6, with 53 passes into tight coverage to Wentz's 44 and Fitzpatrick's 40. No other player is at 40+ attempts.
- Of QBs with at least 100 passing attempts, Russell Wilson has thrown the fewer into tight coverage (14 of 169), followed by Sam Darnold (15) and Cam Newton (20).
- Drew Brees has been long discussed being washed up. Well, it very well could be the case, and he's not really trying to improve by himself. Not only are his 5.3 CAY and 6.1 IAY two of the lowest marks among qualified QBs, but he's also throwing the ball -2.5 yards behind the first-down marker on average. That's virtually the same as hyper-conservative passers as Nick Mullens (-2.8), Teddy Bridgewater (-2.1), and Dayne Haskins Jr. (-2.1).
- Obviously, King of Wilderness Drew Lock leads the league in AYTS (Avg. Yds. to the Sticks) with a monster 4.4 mark. Trubisky is second at a distant 2.0, followed by Aaron Rodgers (0.8), the first of mortals.
Attempts & Yards & Y/A
Correlation with Fantasy Points: 60% / 74% / 67%
Leaders and Trailers:
Leaderboard Notes:
- Not many big secrets hidden in these three stats, am I right? The correlation is high with fantasy points basically because fantasy points rely mostly on pure yardage, and to rack up yards you have to throw the ball (the more the better, that is). Doesn't take a genius.
- Before getting injured (ugh) Dak Prescott was averaging a league-leading 44 pass attempts per game. Now that he's out for the season, Joe Burrow and Matt Ryan both sit at the top of the leaderboard with 41 each. Gardner Minshew II is third (40), and the only other player with a 40+ per-game attempt average.
- Among QBs with at least 100 attempts over the season, Lamar Jackson is making it clear that Baltimore is not about to generate high passing-related numbers. Jackson has attempted the fewest passes per game so far (27), followed by Baker Mayfield (28) and Newton/Cousins (29).
- The sample is small (three games, 73 pass attempts), but Nick Mullens wasn't bad while backing up Jimmy Garoppolo averaging 8.4 Y/A in his appearances this season. Only five other QBs are currently averaging that mark, although all of them have at least 141 pass attempts (Justin Herbert) and as many as 222 (Dak Prescott).
- Speaking of Herbert. The battle of rookie-quarterbacks between him and Burrow is split in half: Herbert is the efficient passer (8.5 Y/A for 1,195 total yards on 141 throws) while Burrow is the volume leader (6.6 Y/A for 1,617 yards on 246 throws).
- Tua will start his first game in Week 8, so we don't expect him to make this column at least until we revisit the quarterback NGS leaderboards in Week 12 (he won't reach enough attempts to meet the threshold just in Week 8 alone).
- Y/A for quarterbacks with 20+ paFP/G: 7.8, 7.9 (x3), 8.4, 8.9.
- Y/A for quarterbacks with fewer than 10 paFP/G: 5.0, 5.7 (x2), 6.1, 6.8, 6.9, 7.5, 8.4.
- Yes, that explains the really-high 67% relationship between Y/A and paFP/G. Bank of bulky throwers, folks.
- Now that we're into Y/A, there is another rather-high relationship between this statistic and touchdown-passing: positive 59% through six games. You might have expected this, or not, but the longer distance an attempt goes for, the higher tally of touchdowns a quarterback tends to rack up.
- Both Deshaun Watson and Willson have the league-leading 8.9 Y/A, and they have scored 13 and 19 passing touchdowns respectively already (tied for fifth-most, and most, respectively).
- On the other end, Daniel Jones and Darnold have just 3 passing touchdowns each (min. 130 attempts) while averaging paltry 6.1 and 5.7 Y/A marks...
Completion Percentage & xCOMP & COMP Above Expectation
Correlation with Fantasy Points: 59% / 26% / 56%
Leaders and Trailers:
Leaderboard Notes:
- The world of hypotheticals is cool, but what truly matters is what actually happens on the field. That is why the real completion percentage is the stat that matters, and why the expected rate doesn't cut a good deal for fantasy GMs.
- That being said, the difference between both marks (CPOE) is also a very strong indicator of fantasy performance, almost on par with actual COMP%, which makes sense considering that those that "overperform" or play to higher-than-expected levels on average are the ones who more often than not put on high-octane performances.
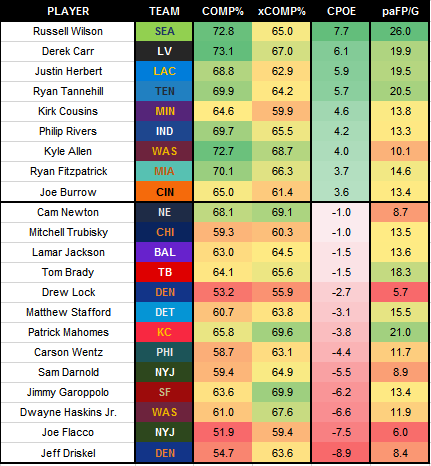
- As ridiculous as it sounds, after six weeks Chef Russell Wilson is the only player over 6.1 CPOE. I mean, he's at 7.7 completion percentage points over expectation, which means he's 1.6 above no. 2 Derek Carr. That 1.6 difference is the same as that between Carr and no. 7 Philip Rivers...
- Say what you want about Carr, but he's been a beast this season--as he usually is on a yearly basis and I won't get tired of repeating. Get Carr from waivers if he's still available there, seriously. He's a QB1 in even the shallower of leagues, believe it.
- While Wilson's 169 pass attempts are far from the league-leading Burrow's 246, they are a fairly high amount to still be putting on a massive 7.7 CPOE over five games. For context, only Kyle Allen (55 attempts) and Justin Herbert (141) have CPOE marks 4.0+ even though they have minimal and lower samples to show for it.
- Once more, Herbert's 5.9 CPOE is way higher than Burrow's 3.6. Another W for the Chargers rookie. Burrow edges Herbert on actual/raw passes completed over expectation 9 to 8, though that's reasonable considering he's tossed 104 more balls over the year.
- Wilson himself has completed 13 more passes than expected. Carr comes second with 11, followed by Tannehill (10) as the only three players at 10+ through W6.
- On the negative side of things, the two of Haskins and Wentz have both missed on 10 passes expected to have ended in actual completions. No other QB has fewer than 8...
- ...does that mean it is time to sit Wentz? Not so fast, folks. Patrick Mahomes' CPOE is a paltry -3.8 (seventh-lowest among qualifiers) but not a single soul is even thinking of benching the former reigning SB champ. The CPOE model doesn't love Mahomes because that model works with knowledge of where receivers are at to calculate pass-completion expectations. What does that mean? The model knows Mahomes is usually throwing balls to wide-open receivers, so every time he misses on them he gets ultra-negatively-impacted on the CPOE front.
- The model isn't dumb and Wentz has been plain bad, though. Don't get it wrong and bench him for good (if you're reading this, then yes, you too, Doug).
- Everybody could have guessed the leader in expected completion rate: mighty washed Drew Brees, at 70.6%. He's the only quarterback, in fact, over 70%+. Talk about trying to stay out of trouble...
- Baker Mayfield, though... The Brown has tossed passes expected to be completed just 58.5% of the time, which ranks as the lowest percentage among passers with at least 100 attempts, and second-lowest (Drew Lock) among qualified QBs.
- Kirk Cousins is the only other 100+ attempts passer below an xCOMP% of 60%.
That's it for today. Until we meet again next week, I hope you can crush your waiver wire, set up the best possible lineup, and get ready for another weekend full of fireworks!
Download Our Free News & Alerts Mobile App
Like what you see? Download our updated fantasy football app for iPhone and Android with 24x7 player news, injury alerts, rankings, starts/sits & more. All free!
 RADIO
RADIO


