Time's up! The 2021 fantasy season is done and gone for good. Whether you play in a redraft league or are part of a dynasty format, the days of sitting at the edge of your couch and biting your nails are over. We have a tough eight-month desert to walk through ahead of us, but hey, the real NFL players are this close to kick-off and we will still enjoy football for another month and change, so you better get to it while it lasts! With the numbers in place and the games finished, it's time to wrap up the series and take a final look at who was who during this 2021 longer-than-ever season.
To gain the biggest edge in your fantasy football league, it's necessary to understand how to apply the advanced statistics being used in sports nowadays. Back in the day, it was all about wins and losses, passing yards, and touchdowns scored. It's not that those stats are now worthless, they just don't offer enough information to savvy analysts. While football is still in its infancy compared to baseball in terms of analytics, the evolution the sport has seen lately in those terms is notable.
Each week, I'll be tackling NFL's Next Gen Stats, bringing you data from the previous week's games with notable takeaways you should consider when assessing fantasy players for the upcoming week. In case you're new to the series, or Next Gen Stats altogether, I recommend you read our NGS-primer. Now, let's get to the data!
Featured Promo: Get any full-season NFL Premium Pass for 50% off and win big in 2022. Exclusive access to our Premium articles, 15 lineup tools, new Team Sync platform, Lineup Optimizer, Premium DFS tools and cheat sheets, and much more! Sign Up Now!
2021 Best and Worst Rushers - NextGenStats
The season, at least for us fantasy nuts, is finally over. That is nothing good for our enjoyment of the fantasy game, but it is a time of calm and peace to enjoy the real NFL playoffs that we're also invested in. With all of the regular season numbers now in place, it is time to wrap up the NextGenStats series position by position.
Today, I will go through the running back position and will provide a final update on how the league's rushers have done in the different metrics we've already tackled during the season. I will only show a small number of names for each category, present the correlation with the fantasy points averaged by the player, skip the gory details, and instead, provide a new "combined" leaderboard at the end of the column.
Keep in mind also that I will only focus on fantasy production as pure rushers, eliminating the pass-catching element from their game. This will concentrate entirely on their total rushing yardage and rushing touchdowns in terms of the fantasy points per game numbers shown (labeled ruFP/G). I will also include an extra column this time, "ruFP/15At", which accounts for the fantasy points a rusher is getting per 15 rushing attempts, which would be considered an RB1 workload on average and allows us to know how different players in different roles would be doing if given the same opportunities.
Note: The cutoff is set at 90 rushing attempts.
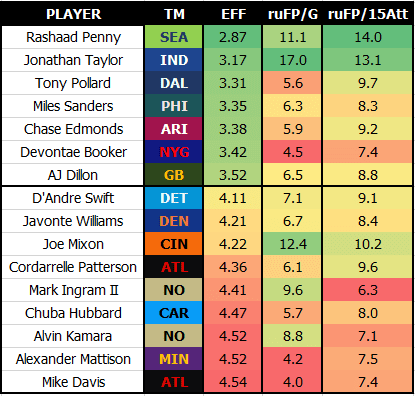
Running Backs Efficiency
Correlation with Rushing Fantasy Points: negative-22%
Leaders and Trailers:
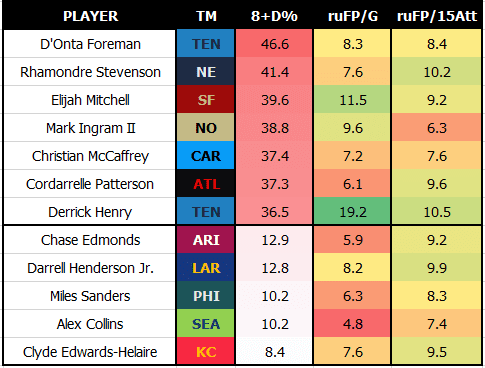
Percentage of Stacked Boxes Faced
Correlation with Rushing Fantasy Points: 20%
Leaders and Trailers:
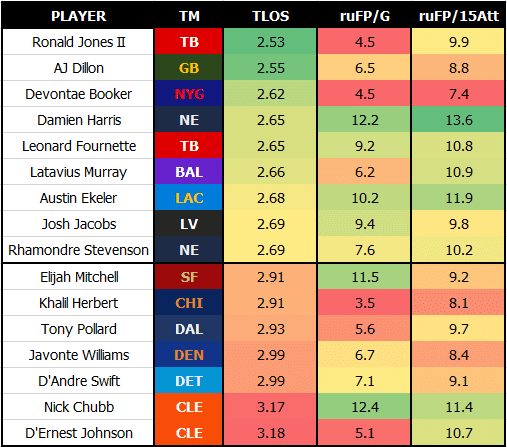
Average Time Behind The Line Of Scrimmage
Correlation with Rushing Fantasy Points: minus-1%
Leaders and Trailers:
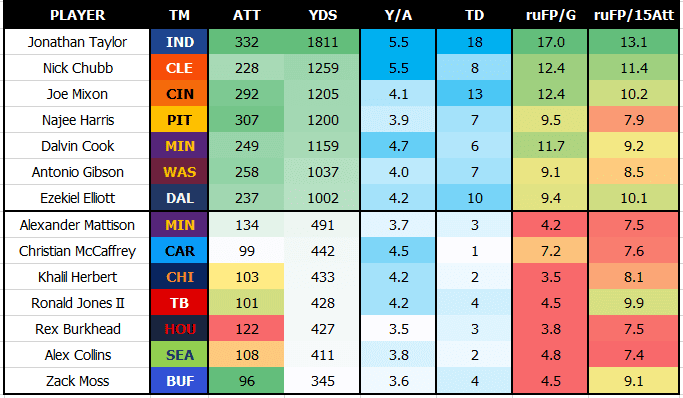
ATT & YDS & Y/A & TD
Correlation with Rushing Fantasy Points: 70% / 78% / 33% / 74%
Leaders and Trailers:
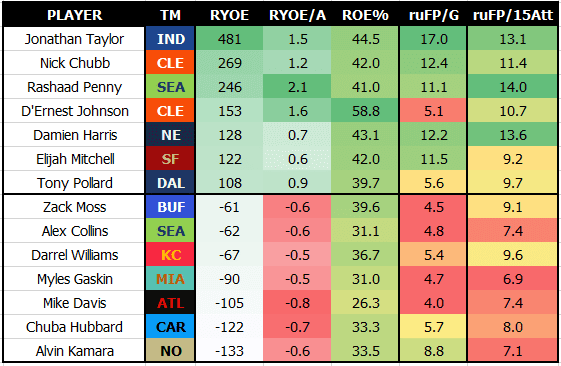
RYOE & RYOE/A & ROE%
Correlation with Rushing Fantasy Points: 51% / 40% / 22%
Leaders and Trailers:
Combined NextGenStats Leaderboard
To build this leaderboard, I used every metric that is part of the NGS site and put everything together in a combined score I labeled "NGS" in the following table. The calculation of each player's NGS score is simple. I calculated where each player ranked for each metric and then multiplied that rank for the correlation between that metric and my ruFP/G metric. Players ranked higher (closer to one) in each category will have lower scores for those categories. In the end, I added up each player's scores from all of the categories, getting a single NGS score.
The lower the NGS, the better the player for fantasy as each category was already weighted given its correlation with the ruFP/G metric. Here are the results:
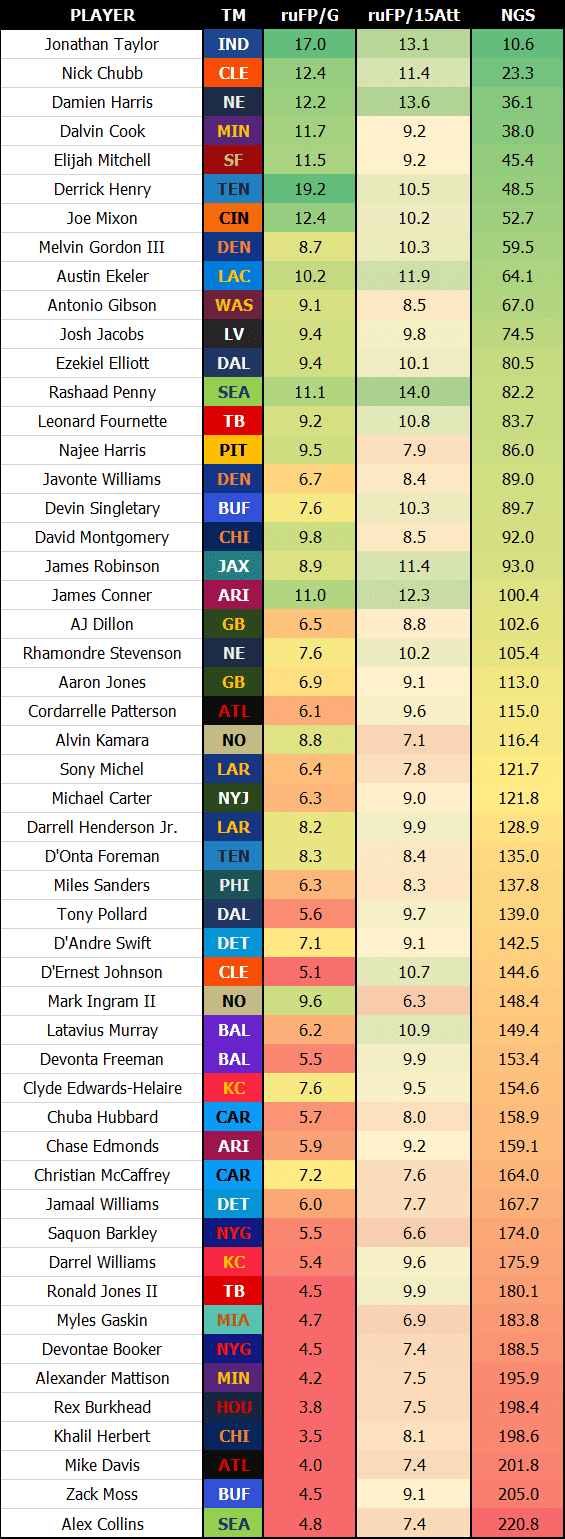
NGS Leaderboard Notes:
- In an otherwise legendary season, the Colts ruined Jonathan Taylor's career year by botching their chances at a postseason berth on the very last week of the season... losing to the lowly and soon-to-be first drafting franchise next spring, the Jacksonville Jaguars. Damn.
- Even then, kudos go to JT for his ridiculous year rushing the rock. Yes, Derrick Henry got injured and missed a huge chunk of the campaign, but that doesn't take from Taylor's exploits.
- Jonathan Taylor more than "doubled" the NGS score of no. 2 Nick Chubb, and that makes as much sense as it can. Taylor finished inside the top-five in all but two categories, and one of them wasn't even under his control (stacked boxes faced).
- Interesting second-best name in that of Chubb. Chubb finished inside the top-five in five different categories, the second-most among non-JT rushers. He beat three other RBs with four such top-five finishes on the year (Joe Mixon, Damien Harris, and Rashaad Penny).
- Chubb was good where it mattered for fantasy. That's why even though he averaged a top-11 finishing across the board and was beaten by Damien Harris' top-eight average finish, he still finished above the Pat in the NGS leaderboard.
- That includes a bottom-five finish in the TLOS cat for Chubb. No other top-25 NGS rusher this season put up such a low/bottom-five finish in a single cat. Kamara is the first one to pop up with a putrid finish in the ROYE cat, ranking 52nd in that single leaderboard.
- It is not that JT racked up the most top-five finishes, it is that he finished top-two in seven of those nine cats!
- The most top-two finishes any other player in the league got were three by Chubb followed by three from Rashaad Penny.
- When it comes to bad years, Alex Collins gets the award with the worst NGS score among qualified rushers. He did so to the tune of two bottom-five finishes. Not happy enough with that, he managed to close the season ranking bottom-10 in all but three of the tracked categories.
- Collins was bad all across the board, but Mike Davis was the actual rusher with the most bottom-five finishes as he was the absolute worst rusher in three different categories (RYOE/A, ROE%, and EFF).
- The correlation between ruFP/G and NGS scores is at a very strong 85% for the 2021 season.
- That 15-percentage-point gap explains the small differences in both ranks:
- Top-5 NGS players: Taylor, Chubb, Harris, Cook, Elijah Mitchell
- Top-5 ruFP/G players: Henry, Taylor, Chubb, Mixon, Harris
- Bottom-5 NGS players: Collins, Moss, Mike Davis, Herbert, Burkhead
- Bottom-5 ruFP/G players: Herbert, Burkhead, Mike Davis, Mattison, Ronald Jones II.
Download Our Free News & Alerts Mobile App
Like what you see? Download our updated fantasy football app for iPhone and Android with 24x7 player news, injury alerts, rankings, starts/sits & more. All free!

Win Big With RotoBaller
Be sure to also check out all of our other daily fantasy football articles and analysis to help you set those winning lineups, including this new RotoBaller YouTube video:
More Fantasy Football Analysis
 RADIO
RADIO


