You won't believe it, but you weren't dreaming. That turkey you stuffed your face with a few days ago? Real. Those three games on a Thursday? Real, indeed. Your weekly meeting with football on the telly this past Sunday? Also real. All of that together only meant one thing: the fantasy football regular season is over (in most leagues and for our purposes at least), and it's time to gear up for that deep playoff run toward the championship. It's funny that it's time to get back to quarterbacks in this week's column. I didn't have it planned this way, but hey, the quarterback is the most important position in football, and some even say the whole sports picture, so what better way to wrap the regular season up than taking a proper look at our game callers?
To gain the biggest edge in your fantasy football league, it's necessary to understand how to apply the advanced statistics being used in sports nowadays. Back in the day, it was all about wins and losses, passing yards, and touchdowns scored. It's not that those stats are now worthless, they just don't offer enough information to savvy analysts. While football is still in its infancy compared to baseball in terms of analytics, the evolution the sport has seen lately in those terms is notable.
Each week, I'll be tackling NFL's Next Gen Stats, bringing you data from the just-completed week's games with notable takeaways you should consider when assessing fantasy players for the upcoming week. In case you're new to the series, or Next Gen Stats altogether, I recommend you read our preseason primer. Now, let's get to the data!
Featured Promo: Get any full-season NFL Premium Pass for 50% off and win big in 2022. Exclusive access to our Premium articles, 15 lineup tools, new Team Sync platform, Lineup Optimizer, Premium DFS tools and cheat sheets, and much more! Sign Up Now!
Who Passed (or Not) the Regular Season Test
So far we have studied which NFL NextGenStats metrics correlate best with each position and its fantasy production. We have also taken a look at other interesting tidbits of information with insights for each of the three positional groups (rushers, receivers, and quarterbacks). The fantasy playoffs will start next weekend in most leagues, and it is time to get to the most important position in football, that of the quarterback. You don't want to mess too much with your team this late in the season entering the final (hopefully) three games of your season, but you also never know what you can find digging a little deeper into the data.
This week I'll inform you about how the regular fantasy season has been for all of the league quarterbacks in the different metrics we've already tackled during the past three months already. I'll be going metric by metric including a leaderboard and commenting on the players and performances I find most interesting, as has been the case in the rest of the series entries.
As we'll be discussing quarterbacks and their passing stats, I will reduce the fantasy points per game averages to just those related to passing. That means that I have removed the rushing/receiving fantasy points the qualifying quarterbacks have logged during the season (that is why Matthew Stafford has a better fantasy average than Lamar Jackson, for example). I've called this "new" metric paFP, which is to say passing Fantasy Points per Game. So let's dive in.
Note: The cutoff to qualify is set at 98 pass attempts.
Time to Throw
Correlation with Passing Fantasy Points: 7%
Leaders and Trailers:
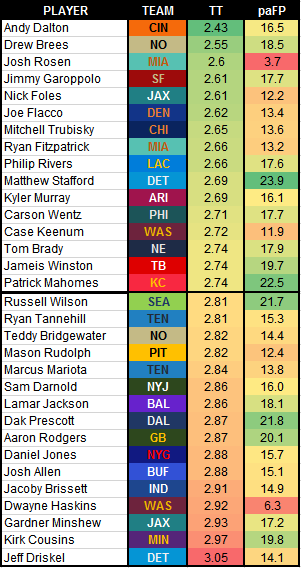
Leaderboard Notes:
- The correlation between this metric and fantasy points due to passing is virtually non-existent (7%). A quick glance at the table above shows a couple of good examples.
- At the top of the leaderboard Drew Brees (2.55 seconds) and Josh Rosen (2.6 seconds) are taking virtually the same short time to throw the ball while one is posting more than 18 paFP per game while the other isn't even reaching 4 paFP.
- The quarterbacks averaging at least 20 paFP per game (Stafford, Mahomes, Prescott, Wilson, Rodgers, and Ryan) have TT marks ranging from 2.69 (quickest, Mathew Stafford) to 2.87 (slowest, Dak Prescott and Matt Ryan).
- Those averaging fewer than 13 paFP per game (Rudolph, Foles, Keenum, Haskins, Rosen) have TT marks ranging from 2.6 (quickest, Josh Rosen) to 2.92 (slowest, Dwayne Haskins).
- It might look like low fantasy-point scorers tend to throw quicker, but on average and looking at the whole picture (again, 7% correlation) there is nothing hidden in this metric.
- Quick throwers historically have had worse completion percentages. Again, that has not been the case this season, as the relation between TT and COMP% is only of a negative-10%, virtually dismissable.
- Just as an example, Andy Dalton (2.43 seconds, quickest) has completed 60.3% of his passes while Drew Brees (2.55 seconds, second-quickest) has completed 73.8% of his.
Completed/Intended Air Yards / Air Yards Differential
Correlation with Passing Fantasy Points: 60% / 40% / 26%
Leaders and Trailers:
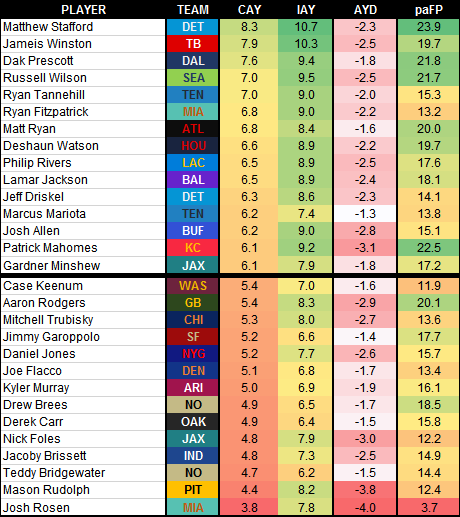
Leaderboard Notes:
- Of the five players averaging 7.0 or more CAY, we could say that only Ryan Tannehill falls under the 20 paFP threshold (Winston too but by a mere 0.3 paFP). That is logical, considering air yards are factored into the fantasy points a quarterback scores, although the relationship is relatively "low" (60%) because there is more to the actual fantasy points a quarterback generates (yards after the catch and touchdowns).
- Patrick Mahomes and Aaron Rodgers are two outliers among all qualifying quarterbacks. They are averaging more than 20 paFP per game, but with low CAY marks of 6.1 and 5.4 respectively. Only Jimmy Garoppolo and Drew Brees are close to that fantasy production while carrying CAY values of 5.4 or lower.
- Ryan Fitzpatrick's case is interesting. He has one of the highest CAY marks at 6.8 but his paFP average is really low at 13.2. That means that he's not being helped by the Dolphins receivers with yardage gained after the catch. Therefore, all of Fitzpatrick's value comes from his passing, and not much else (the interceptions don't help either).
- Mahomes is throwing some good bombs downfield (IAY 9.2) and has the third-highest differential (3.1) among qualifying quarterbacks. Again, only he and Rodgers are on a 20-plus paFP average with a differential higher than 2.5 AYD.
- No surprises at the top of the IAY leaderboard with Stafford and Winston throwing for 10-plus yards downfield on average. That has served them well, as both are virtually on a 20-plus paFP average and getting 7.9 or more CAY per attempt.
Aggressiveness
Correlation with Passing Fantasy Points: negative-23%
Leaders and Trailers:
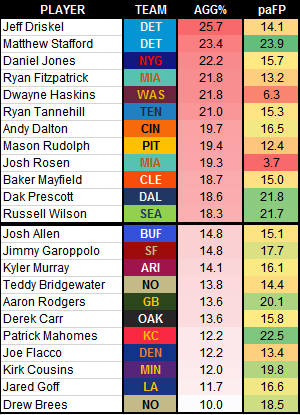
Leaderboard Notes:
- Jeff Driskel only played three games but those were enough to make the cut with 105 attempts. As many as 25.7 percent of his attempts (27 of them) were deemed "risky" passes into tight windows, making him the most aggressive passer in the league. His 4:4 TD:INT ratio makes sense knowing his traits as a passer.
- It is also interesting how another Lion, Stafford, is second in AGG% at 23.4. He's been much better than Driskel, though, with a 19:5 ratio and almost 24 paFP per game in his eight games.
- Dak Prescott is the first quarterback still active and starting who is averaging more than 20 paFP while on a high AGG% mark. Even with that, though, he's still miles away from the league-leading values posted by other starters such as Daniel Jones.
- Patrick Mahomes and Aaron Rodgers are (again...) the only two quarterbacks posting more than 20 paFP per game while throwing fewer than 15% of risky passes into tight windows. Cousins misses the cut by a hair as he's averaging 19.8 paFP per game but also throwing even fewer risky balls (just 12% of his attempts).
- Had Drew Brees played more games and attempted more passes (currently at 240), his AGG% would have been at least a little higher. What is surprising is the fact that Jared Goff has only an 11.7 AGG% while he has attempted a massive 467 throws! Cousins, at the third-lowest mark (12%) has thrown only 358 in comparison. Perhaps Goff should risk it a little bit more, though considering his horrific late-season performances it might be better for him to keep things as safe as possible...
Attempts / Yards / Y/A
Correlation with Fantasy Points: 65% / 77% / 76%
Leaders and Trailers:
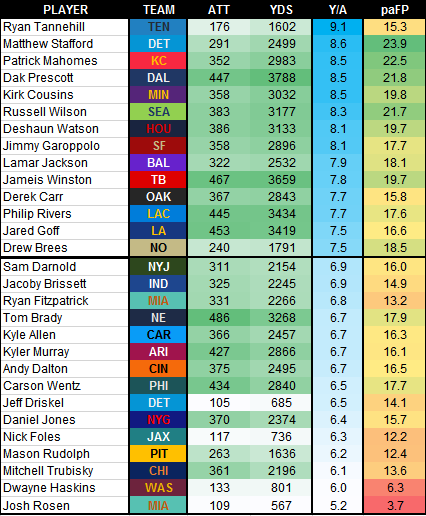
Leaderboard Notes:
- Ryan Tannehill's season has been absolutely unconscious since he took over Marcus Mariota earlier in the year. He has thrown 176 passes for 1,602 averaging 9.1 Y/A, which is 0.5 more than second-most 8.6 by Matthew Stafford. No one is even close to reaching him, but it'll be very hard for Tannehill to keep that torrid pace up.
- Dwayne Haskins has been a little disappointing for Washington even as a rookie. More troubling is Mitchell Trubisky's season in which he's averaging just 6.1 Y/A and looks a little stalled. Something similar is going Carson Wentz's way, who is also disappointing in 2019 although it's also true that the Eagles attack has lacked depth at the receiving position all year long.
- Although Tom Brady has the fifth-most yards in the season, he's needed the most attempts (486) to get them and that explains his low 6.7 Y/A.
- Teddy Bridgewater was more than fine backing up Drew Brees during the latter's injury: Bridgewater attempted 195 passes for 1,370 yards, averaging 7.0 Y/A. Getting back to another "replacement" quarterback, Ryan Tannehill, you can see how the comparison is ridiculous as Tannehill has played almost the same amount of snaps yet his numbers are way over Bridgewater's. The regression will sooner or later arrive, and it could be right around the corner for Tannehill.
Completion Percentage / xCOMP / COMP Above Expectation
Correlation with Fantasy Points: 52% / negative-9% / 63%
Leaders and Trailers:
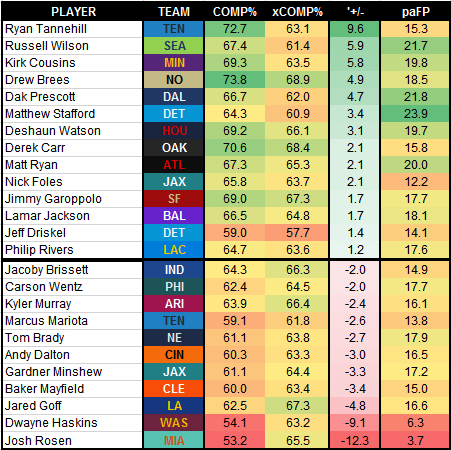
Leaderboard Notes:
- If you needed harder facts about Tannehill's ridiculous season just take a look at the table above. He is completing almost 10% more passes than he should (by historical data). That is plainly insane, with Russell Wilson coming in second over-performing expectations by an already high 5.9%.
- Drew Brees (73.8%) and Derek Carr (70.6%) are the only other players with a completion rate over 70%. Their cases, though, are much more "believable" that that of Tannehill as both of them had been expected to complete at least 68% of their passes compared to Tannehill's 63%.
- In fact, 33 quarterbacks have thrown at least 175 passes this season and Tannehill's xCOMP% of 63% would rank 24th among them.
- While Russell Wilson has been on the MVP conversation for a while now, that has been due to him clearly beating expectations. He's completing 67.4% of his passes while history says he should be at 61.4%. That is a 5.9% gap and he would rank 30th in COMP% if he actually was completing just 61.4% of his throws!
- Josh Rosen and Dwayne Haskins aside, both Baker Mayfield (negative-3.4) and Jard Goff (negative-4.8) have had the two most disappointing seasons to date in terms of COMP%. They should be completing more than 63% and 67% of their passes respectively, but each of them is under 63% through 13 weeks.
- Of the 13 quarterbacks with a COMP% under 62% on the season, only Tom Brady, Jameis Winston, and Baker Mayfield started in Week 1 and have avoided being sent to the bench at some point.
- Once again, Mahomes and Rodgers are the only quarterbacks with 20-plus paFP per game and a negative differential between their COMP% and xCOMP% marks. Winston is the next in line averaging 19.7 paFP with a negative-0.2 +/-.
That's it for today. Until we meet again next week, if you are not part of the playoffs you can always start planning for next season by finding what you did wrong in this one. If you are indeed part of the final group of teams fighting for the chip, go ahead and smash your first opponent, make it to the second round, and then get ready for the final game before looking at that trophy straight in the eyes--well, assuming you can sweep the semis, that is.
 RADIO
RADIO


