 RADIO
RADIO


Welcome back to RotoBaller! I'm Jon Anderson, and today we are back for another edition of the OUTLIERS series. Every week (or so), we will be looking into the season-long and recent data to identify outlier data points. We will then dive into the numbers and talk about why those numbers are outliers, and what that means we should expect moving forward.
This will be helpful for fantasy purposes in identifying what player performances are unsustainable, on the negative or positive side of the coin. Baseball is such a random game that we constantly see box score outputs that just don't really make any sense given the underlying inputs. We will identify a handful of these every week, which should help us decide on what players to buy or sell.
It will also just be a general fun time learning more about the stats and indicators, what they mean, and how to interpret them. This is my bread and butter, so I'm ready to start spreading it. Let's do the thing!
Editor's Note: Our incredible team of writers received five total writing awards and 13 award nominations by the Fantasy Sports Writers Association, tops in the industry! Congrats to all the award winners and nominees including Best MLB Series, NFL Series, NBA Writer, PGA Writer and Player Notes writer of the year. Be sure to follow their analysis, rankings and advice all year long, and win big with RotoBaller! Read More!
Outlier: Matt Carpenter's Home Run Rate
NOTE: This article was written and published before news of Matt Carpenter's foot injury.
One of the best indicators of home runs is barrels. This season, 85.2% of homers have been classified as barrels. That means the more barrels you hit, the more homers you should expect to hit.
Home ballpark and swing speed do factor into the equation and not all hitters are equal even on these limited inputs, but it remains a good thing to check to get an idea about what's happened in the past and what might happen shortly.
League-wide, 47% of barrels have gone for a homer. This number goes up or down based on the time of year (hotter months = higher rate of homers), ballpark (the two extremes being Cincinnati and Detroit), pull rates (pulled barrels are more likely to go for a homer), and other things. All of these are things to keep in mind before we look at the plot, but now that we've said it – let's get to the plot.
What we see here is each hitter's Brl/PA plotted against their HR/PA. As one goes up, so should the other, so here you go:
The biggest outlier we can find is Matt Carpenter. He has homered 15 times in 152 plate appearances, homering once every 10.1 PA's on average. The fact that he leads the league in home run rate made it a pretty good bet that he'd turn up on the outlier list here, but he's really taken it to an extreme. His barrel rate of 13.7% is quite good, but it's nowhere near the league leaders. We have six hitters with season barrel rates above 20% and 14 more above 15%.
Now, Carpenter does fit the mold of a guy we should expect to be a bit of an outlier here. I say that because he pulls the ball a ton (57% of his batted balls are pulled), he hits a ton of fly balls (40% FB% – fourth-highest in the league), and plays in Yankee Stadium (fifth-best park for turning left-handed barrels into homers).
So we should expect Carpenter to be well below the trend line, but he's taken it to an extreme that I just don't believe can keep up. We've seen a slow-up already, as Carpenter has hit just .229/.321/.438 with two homers and posted a 5.1% Brl% in his 56 plate appearances since the All-Star break.
It's reasonable to try to trade him away now if someone will give you a nice return (although your league's trade deadline has likely passed as well, so sorry about the late tip here).
Outlier: Eloy Jimenez's Home Run Rate
Referring to the scatter plot above, Eloy Jimenez finds himself on the other side of the outlier list. He has a 17.8% Brl% this year in 128 plate appearances, that's good for 9th-best in the entire league.
He has also limited strikeouts to 24%, just a touch above the league average. Despite those two good numbers, he has homered just six times in those plate appearances. It's still a strong home rate of one homer every 21 PA's, but it seems like that mark should be better.
There are eleven hitters in the league meeting these criteria:
- 100+ PA
- K% between 20% and 28%
- Brl% between 14% and 22%
Of those hitters, Eloy's 21.3 PA/HR is fourth-worst (Max Muncy, Ryan Jeffers, and Julio Rodriguez are ahead of him). Eloy is swinging the bat incredibly well right now, and I expect him to be one of the game's best power hitters down the stretch.
Outlier: Ronald Acuna Jr.'s Summer Slugging
Here's some of what Acuna has done since June 1st
| PA | Brl% | Hard% | K% | BB% | Cont% | xwOBA | xSLG |
| 235 | 12.3% | 48.1% | 19.6% | 9.4% | 74.2% | .360 | .505 |
Those numbers are all very strong, and yet Acuna's slugging percentage over that time sits at just .396. He's homered just seven times since June 1st.
I think a lot of fantasy managers with Acuna on their team may be thinking his lackluster performance this year has to do with the injury stuff, and while that might explain some of it – there's certainly been plenty of bad luck here as well. Acuna's profile looks really strong right now, and I would expect a strong finish to the season for him.
By the way, the aforementioned Matt Carpenter is on the other extreme here with a differential of .234 between his slugging and expected slugging (.746 actual vs. .512 expected).
Outlier: Triston McKenzie's Run Prevention
We see a pretty big differential between McKenzie's 4.02 xFIP and his 3.16 ERA, but that's not what called my attention to him. I checked pitchers with strikeout rates below 25% and ground-ball rates below 40% to see what pitchers were also posting low slugging percentages, and he's the #1 guy on this list.
Now, this isn't necessarily "good luck" because you can certainly do some things to make the fly balls you give up hurt less, and that stuff can be sustained – but overall I think McKenzie is really not earning the .362 SLG against he's posted this year.
Over 20 starts, McKenzie has struck out just 24.4% of the batters he's faced (about average), and he's walked 6.7% of them (that's a good number). Most of the batted balls he's given up have been in the air (33.5% FB%, 24% LD%), and he's given up a high barrel rate of 10.4%.
Despite that, his home run rate is solid at 27.6, and the slugging percentage against is really low as we already mentioned. The expected SLG paints a prettier picture since it's at just .415, which isn't awful – but the xERA of 3.89 shows a pretty big gap between expectations and reality. I think McKenzie needs to start striking hitters out at a higher rate (which he can do and has done) to maintain this strong ERA.
Outlier: Brandon Drury's wOBA
A lot of people were worried about Drury's fantasy value if he were to get traded away from Great American Ballpark. That was a completely reasonable worry, as Cincinnati has arguably been the best ballpark in the league this year for hitters. However, it seems there's a bigger worry in Drury's profile right now.
Since June 1st, Drury has put up a .380 wOBA, quite a bit above his .289 expected wOBA. Here are the 15-day rolling averages of wOBA and xwOBA from my own personal Tableau dashboard.
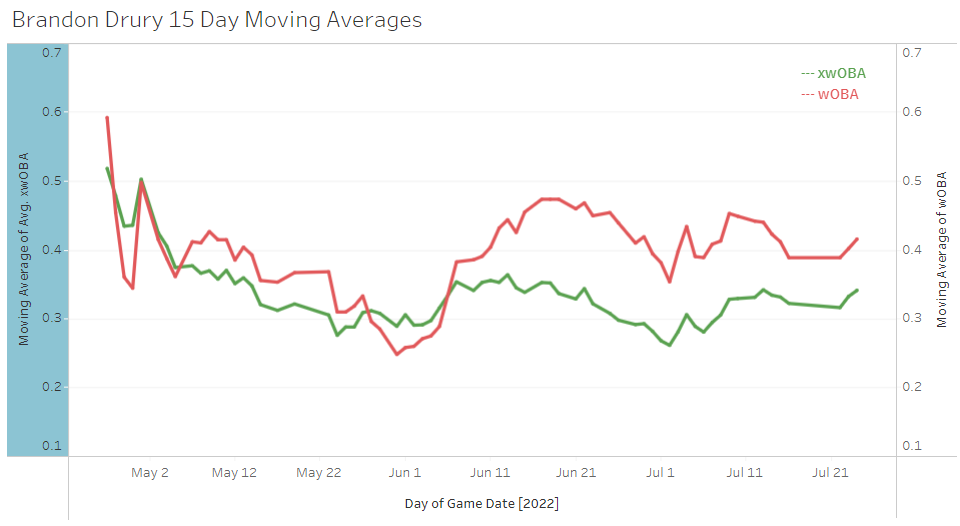
You can see that at the beginning of the year, he was outperforming his xwOBA, but not a ton, and the two lines crossed over a few times there. However, since around June 9th, the wOBA line (red) has really crushed the xwOBA (green) line.
Over the last three seasons, the overall park factor on Great American Ballpark is 111, adding 11% to hitter production. Comparatively, Petco Park is at 95%, taking 5% off. That's quite a big swing for Drury, who we should have already been worried about given the wOBA outpacing the xwOBA by such a big margin.
And that's it for another edition of outliers! Thanks for being here!
Download Our Free News & Alerts Mobile App
Like what you see? Download our updated fantasy baseball app for iPhone and Android with 24x7 player news, injury alerts, sleepers, prospects & more. All free!

More Fantasy Baseball Analysis


