
Here at RotoBaller, we are always searching for ways to give our readers the best fantasy sports content possible. With that goal in mind, I am very proud to launch the introduction to my weekly-updated PGA DFS Rankings Wizard - a powerful and interactive data spreadsheet, allowing user inputs to create custom rankings and DFS models for PGA DFS contests.
Unlike most sports, golf is a unique beast because of the constant moving pieces that we have thrown our way for a tournament. Not only do we see golfers rotate in and out between events, but the venue and skillset needed to find success is the core of what our weekly research process becomes. Using our insight and knowledge to gain an edge over all avenues of the gambling sector becomes achievable with added effort, which is why so many mathematical systems have been constructed with the hopes of solving the weekly puzzle.
My PGA DFS model currently has eight individual subsections included, which will help provide continuous research throughout the week. We will get into how to use all the unique features available for your consumption during this article, and I hope you consider making this a part of your weekly digestion of golf data. You can follow me on Twitter @Teeoffsports if you have any questions!
Featured Promo: Want a free RotoBaller Premium Pass? Check out these sports betting promo offers from the top sportsbooks! All new sign-ups get a free bonus offer on their first deposit, and a free year of RotoBaller's Premium Pass for all sports ($450 value)! Sign Up Now!
Spencer's PGA DFS Rankings Wizard - 2020 Memorial
This week's sheet is available right now. Just click the link to get started on your research!
Then be sure to read through my 'How To' guide below, to take advantage of all the features.
The Table of Contents
When you click on the link to my PGA DFS model for an event, you will initially get taken to the 'Table of Contents' section. Here is an idea of what you will see:
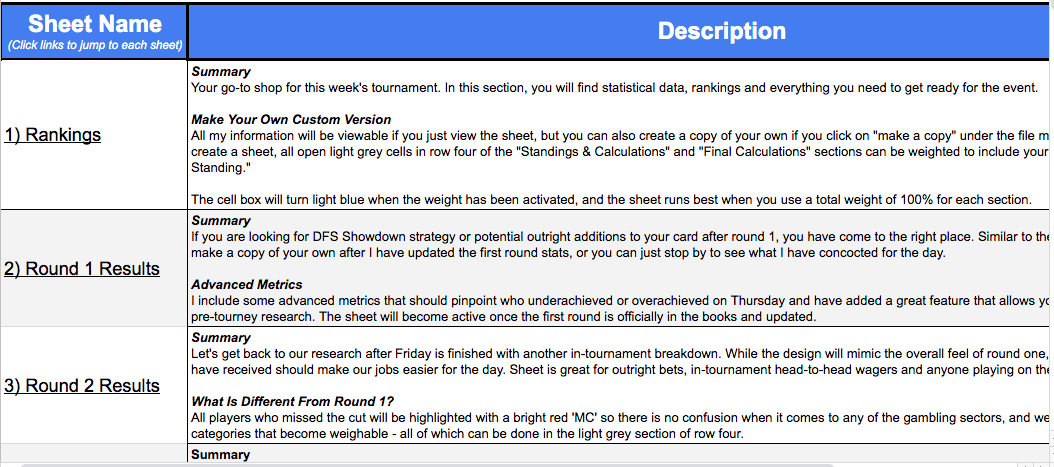
There are a handful of quality features about this region that I like from a user standpoint. Not only do we have the descriptions for all eight areas in one place for those that are trying to gain a better understanding of what to expect, but all sheet names contain a link to take you to the section you are looking to find.
Here is a list of the segments and their descriptions.
Breaking Down Each Spreadsheet Section
1. Rankings - Your go-to shop for that week's tournament. In this section, you will find statistical data, rankings and everything you need to get ready for the event.
Make Your Own Custom Version - All my information will be viewable if you just view the sheet, but you can also create a copy of your own if you click on "make a copy" under the file menu option. If you do choose to create a sheet, all open light grey cells in row four of the "Standings & Calculations" and "Final Calculations" sections can be weighted to include your very own personal "Calculated Standing." The cell box will turn light blue when the weight has been activated, and the sheet runs best when you use a total weight of 100% for each section.
2. Round 1 Results - If you are looking for DFS Showdown strategy or potential outright additions to your card after round 1, you have come to the right place. Similar to the 'Rankings' tab, you will be able to make a copy of your own after I have updated the first round stats, or you can just stop by to see what I have concocted for the day. I include some advanced metrics that should pinpoint who underachieved or overachieved on Thursday and have added a great feature that allows you to weigh back in your pre-tourney research. The sheet will become active once the first round is officially in the books and updated.
3. Round 2 Results - Let's get back to our research after Friday is finished with another in-tournament breakdown. While the design will mimic the overall feel of round one, the enhanced information we have received should make our jobs easier for the day. The sheet is great for outright bets, in-tournament head-to-head wagers and anyone playing on the DraftKings 'Showdown' slate. All players who missed the cut will be highlighted with a bright red 'MC' so there is no confusion when it comes to any of the gambling sectors, and we will gain a handful of additional categories that become weighable - all of which can be done in the light grey section of row four.
4. Round 3 Results -We are almost to the finish line for the week, but we will get one last opportunity on Saturday night to use the vast array of statistical combinations at our disposal. I tend to make my 'Round 3 Results' sheet geared towards outright wagers, so if you are only viewing it and not making a copy, keep that in mind. Everything that has happened for the event will be in one place, and it should provide a complete picture of what has transpired.
5. Previous Winner After Each Round - This is a brand-new idea that I have created to help highlight where the eventual champion of the tournament has been located after each round. As the sample size grows, the goal is to be able to pinpoint any potential corollary trends between both specific tournaments and individual players. While the actual information in the sheet shouldn't be touched, you will be able to sort any specific column to see the most common trends and biggest comebacks. A feature has been added in the final three columns to signify the average position after each round, making it an interesting tool if you are hoping to find value.
6. Putting Regression - We all know that putting can be the most random statistical category when it comes to golf, so wouldn't it be nice to have previous trends at your disposal? Starting at the 2020 Travelers Championship, I have been tracking every player that has either gained or lost two-plus strokes in a given round. The goal is to see how a golfer follows up an aberrational result, and I have included a handful of ways to decipher the information. The number of strokes gained for the day will be included, as well as a baseline performance from each player, their deviation from the norm, what the round amounted to from a scoring standpoint and how did their driver or irons help or hurt in the performance. We will then go back the next day and include how they produced in the same categories. This will give us our putting differential, place differential and OTT+APP differential. Last but not least, we will take a look at the overall strokes gained or lost on average in the follow-up performance and how many places better or worse it resulted from a scoring standpoint. I do not include round four statistics because of the uncertain nature of nerves affecting the outcome.
7. 3x+ Scoring Average - This sheet is exactly what it sounds like it would be. We are looking at players who generated a score for the day that eclipsed the field scoring average by over three-times the total. There is always a stigma around golfers that they can't provide back-to-back pristine performances, and this should give us an idea of how big of an overall letdown is likely (if any). The follow-up score will compare the scoring to the field average for the day, and there will be additional columns to sort for a better gauge of things. Column "M" will give us our average follow-up score to the field. The bigger the sample size gets, the more useful the tool should become.
8. My Betting Card - While not directly included onto my spreadsheet, the link will take you to the personalized betting recommendations that I have included for RotoBaller. The card will get updated daily for any new additions once the tournament begins.
Now that we have gotten the introductions out of the way, let's get into some of the meat of what separates my sheets from others.
Rankings Section
The majority of your pre-tournament research is going to be spent here. However, before we get into all the intricacies of the product and what to expect, I want to stress one more time that the sheet is available to have a copy made for your own weekly research.
It is not a necessity that you go this route, and just viewing what I have constructed is perfectly okay, but a model can be made if you go to "file, make a copy." I'd recommend going that route regardless of your plans because it provides you the ability to search every column without crashing the sheet, and the capability to find something that might stick out on your end could be vital.
Golfer Details
When you enter this page, the first thing you will see is "Golfer Details."

'Overall Rank' is a segment that we will touch on later and how it is constructed, but your basic information of DraftKings price, projected ownership and opening betting odds can be found here. I have frozen this area so that you will always have it in your line of sight as you traverse the sheet, making it easier to know what golfer you are looking at and some of the essential data needed.
Betting
When we move a few slots over to the right, you will come across a heading called "Betting."

There are a few things that I enjoy about this section from the mentality of a gambler. First off, it is interesting to see where the movement has occurred between Monday to Wednesday, and we highlight that with our drift percentage feature. A negative number will show red, indicating that a golfer has dropped in price, and a positive figure will show blue - highlighting there has been an increase in odds over the two days.
If you read my 'Vegas Report,' you will notice I talk a ton about the hold percentage from a casino. Outright wagers can be a tricky platform to maneuver around because casinos take something that can never exceed an outcome higher than 100% and amplify their edge with the percentage of money they decide to hold. Technically, this is no different than a book placing your typical 10-cent vig (-110) on both sides of a wager to create a long-term edge in their favor of 2.4%, but the more significant difference comes down to the amount of an advantage casinos decide to take upfront on an outright bet.
To break this down into terms that may be easier to understand, when a sporting contest starts, a potential outcome ranges between 0.01% and 99.9% to occur. As the game goes through its stages from beginning to end, we eventually get to the point where one team/player is your winner (100% win equity), and the other ends the competition as the loser (0% win equity). This is important to note because if casinos were posting "true" odds on a contest, all the players in the field would total 100% win equity after being priced out.
For obvious reasons, most notably because sportsbooks would never turn a profit if they treated the market in that sense, we see them shift the odds to create a betting board that is weighted in their favor. Now, the answer of value surrounding individual wagers and things of that nature will take things a step further, but the "total hold percentage" should emphasize to you that numerous players in the field are extremely overvalued in terms of their odds when you get boards outrageously priced over 100%. Our goal is to pinpoint where the incongruities are located and try to exploit an edge of our own on the golfers that might be underpriced.
The win equity region of my spreadsheet derives from what the casinos have listed for the week. An implied win equity of 7.14% means the casino has priced that specific golfer at 14/1 to win the contest - an easier to understand math equation would be a 20/1 player equaling a five percent implied win. I don't want to overstate the significance of the red-boxed hold percentage feature that shows 148.97% in the image because each betting board is different, and it is possible that a 110% hold can be awful, while a 148% hold can be brilliant for the bettor, but it should give us a general idea of how large of an edge we are going to need to overcome in a particular week. I have color-coded that feature to show blue when priced under 140, gray between 140.1 to 146.9 and red when valued higher than 147.
Summary Rankings

Welcome to the kitchen of this bad boy. Here you will have an opportunity to construct your very own recipe. Using last week's tournament as an example, there will be a handful of different ways to weight your data. 'Statistical Analysis' is something that you will have a chance to reconstruct later in the sheet to alter the rankings away from mine, Muirfield Village (or the course of that week) is your course history data and the next few sections will be your current form from different durations of time. This quadrant has a few things that I need to point out, and a few features that I like from a visual perspective.
You can remodel your weight percentage in any fashion you deem fit if you make a copy of your own, but the sheet works best when calculated to include a total of 100% weight under 'Overall Rank.' If you recall from 'Golfers Detail,' this where your 'Overall Rank' comes from. I've noticed I have my best results when I don't include more than 50% of my total onto course and current form, but it is completely up to you with how you would like to attack with your weighted totals.
One of my favorite features I have built into the sheet is how the cell box changes color under 'Overall Rank.' Anything that isn't weighted to 100% will turn red, and you will get your green light of sorts when you total 100%.
Model Differential

I love everything about this idea, and it is something I find myself using more than practically anything else when trying to find cheap value on DFS sites. What this tool does is compare your model to both DraftKings and the betting market.
Once you have constructed your weights on all sections and get your calculated overall rank, that number is compared to the ranking value of those two avenues. The disparity between your sheet and those sectors will be highlighted with a numerical value of difference.
For example, if Matthew NeSmith was the 86th highest priced betting option and 72nd ranked DraftKings player when it came to price, yet your model had him ranked 12th, it would be showing him to be 74 spots lower than expected for betting and 60 spots below your expected value for him on DraftKings. It was one of the core things that pushed me onto a min-priced Seamus Power at the Rocket Mortgage, Corey Conners at an astronomical 250/1 price tag at the Valero Texas Open and is a brilliant tool to locate underpriced options.
Miscellaneous Stats

Most of the categories in this area are self-explanatory. Betting position and DK position would be your numerical ranking in price for the player. Odds versus DK is your difference between those two. I use it as a tool to highlight potential value. Average DK points and ranking of those come next. Consecutive cuts would be your players who are the safest options to make a cut. Par or better streak is viewed by the number of rounds in a row a golfer has been greater than or equal to par, and the % of available purses won does give some indication for potential OAD selections.
Course History

If available, this section will always give you your course history over a span of five years. I go through and change all missed cuts to an 80 to lessen some of the short-term blow for any players that kamikazed a previous performance, and I do give every golfer that hasn't played at the venue a core average of 55. You will have the ability to change those numbers if you choose to when you make a copy, but I tend to find it to be the least interfering range.
Recent Results
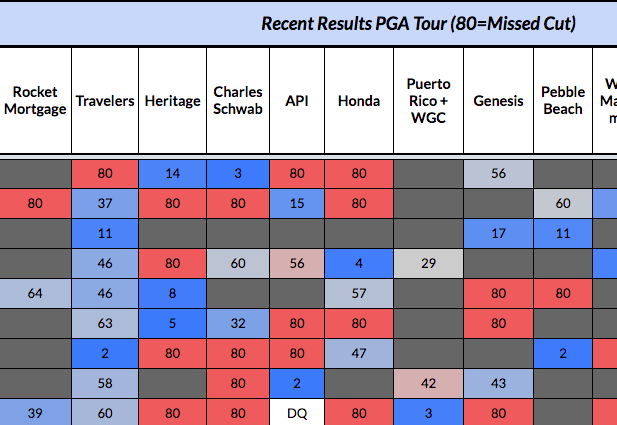
Another pretty straightforward domain once you are aware that all missed cuts are turned into an 80th place finish. The last 10 weeks on the PGA Tour will be listed for your viewing pleasure, and the names of the events will make information easier to find. Your choice of either the last five or 10 weeks becomes weighable under the 'Summary Rankings,' but even if you only want to view this from a mentality of trying to find players in form, it is an excellent tool to use for that thought-process.
Statistical Data
The range of additional statistical information will vary from event-to-event, but five main analytical areas will always be in play: Strokes Gained, Scoring, Par Save, Driving and Iron Play. The nearly 25 stats that incorporate the weekly template will come back into use one last time at the end of this sheet in the form of a ranking, but here you can find how a player performs numerically in different categories.
Recent Differential Over Historical Data (Last 24 Rounds)
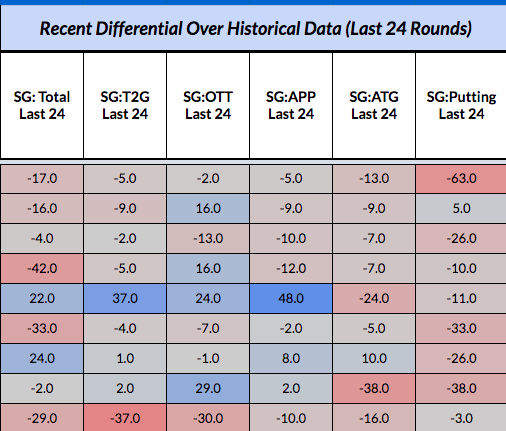
Everything is in the form of a plus-minus, but the key SG measures are compared to the long-term history to get a differential in recent performances over the last 24 rounds. The higher the number, the more a player is overperforming as of late, and we flip that for totals that run into the negatives. This tool is best used to find outliers.
Standings & Calculations
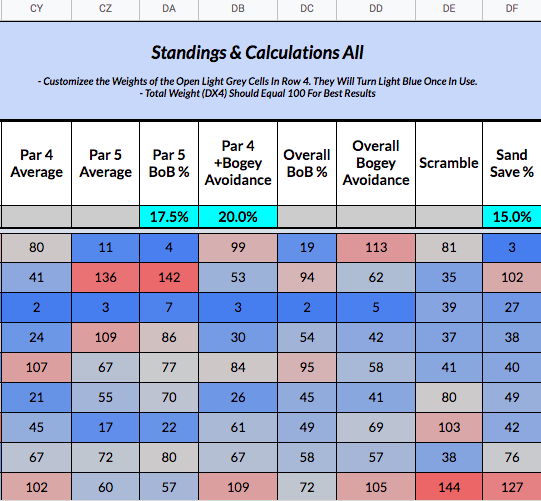
We have finally reached the end of the "Rankings' sheet. All of our previous statistical categories have been turned into rankable totals compared to the field, and the option to place weights on what you want to highlight into your research comes back into play.
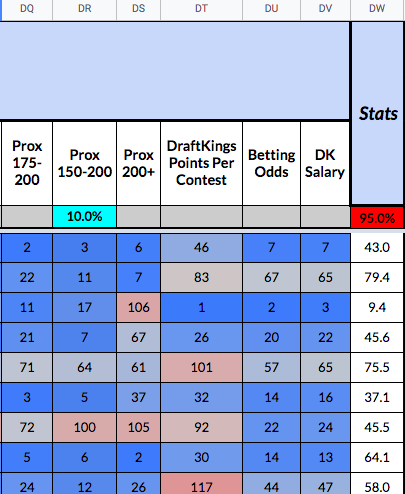
As you can tell by the example above, the cell box in 'DW' will remain red if not equal to 100% with all your weights, and the statistical total that the golfers earn is where the ranking for 'Statistical Analysis' comes into play.
Conclusion
We touched on one of the eight sheets in-depth today, and as you can tell, there is a ton of information available. The individual round sheets will run in a similar fashion of having a 'Summary Rankings' tool to recalculate your in-tournament research, and the putting regression, scoring average and previous winners tools will always be updated for the following week's worksheet. Thank you for taking the time to read this article, and I truly hope you consider trying out this model that I am extremely proud to be sharing with RotoBaller.
 RADIO
RADIO


