As we lead up to the 2021 season, fantasy baseball enthusiasts are sure to read thousands of words about players themselves: who overperformed last year and who is primed for a breakout. All of that is good stuff, and it's very helpful in starting your journey towards winning your league, but it's only half the battle.
There is very little talk on websites like this one about the strategy of the game. Improving in this area of the game is the easiest way to improve your results quickly. You can draft a great team of players but if you do not draft with intentionality towards your league settings, you can only go so far. The first thing you should lock down when preparing for a season is how to best play to the rules of your individual league.
This applies more so when we are talking about category-based leagues. In this article, I will offer some philosophical and tactical tips to help make your fantasy team better before you even draft a player.
Featured Promo: For this week only, take 50% off any full-season or yearly Premium Pass on the site! Just enter discount code THANKS when checking out. Thanks for being a reader, and Happy Holidays! Sign Up Now!
Tip #1: Know The Distributions
You can grab an immediate advantage on your league mates just by knowing more about the categories than they do. For example, if you are a league that uses stolen bases as a category, it's very helpful to know where the league's steals are coming from.
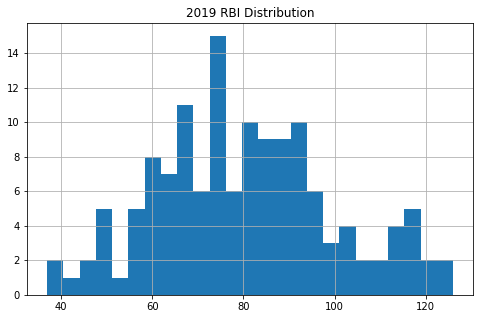
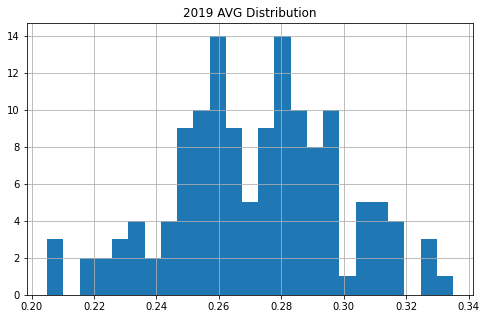
I looked at the numbers from 2018 and 2019 to see what the distributions for the standard five categories looked like. Here are the histograms; I used a cut-off of 500 plate appearances to get rid of some of the noise.


Runs and RBI are basically the same, they both are pretty close to bell curves with most of the values in the middle of the plot. Fifteen players made up the top 10% in the runs scored category, those 15 players scored 15.4% of the runs in this sample. That numbers were almost the same for RBI, with 14 hitters making up the top 10% and those hitters driving in 14.9% of the runs in the sample. For home runs, it's a bit more concentrated, with the top 10% of contributors accounting for 17.2% of the sample's homers. For steals, the top 10% stole 35.1% of the bases.
This knowledge should lead you to be very aggressive on steals in your draft. There is such a limited supply of steals to be had that it justifies really paying up for the guys that are sure to steal bases. If you had Mallex Smith and Jonathan Villar on your fantasy team in 2019, they gave you 86 steals. That would probably have been good for a 15% share of your league's total steals or so. You would likely have been completely dominant in steals using just two roster spots on the category. This simply is not possible to do in any other category.
Another point to make is that stolen bases are the easiest category to predict. There is very little randomness in steals comparative to other categories. Being aggressive on getting steals in the draft immediately moves you up in the standings, so you should do it.
The home run category is like this too, but to a much lesser extent than steals. There is less randomness in home runs than in runs and RBI, and it is typically a top-heavy category. While homers is also a fairly deep category (you can see above how many hitters went over the 30-mark), it still makes sense to lock in a couple of the guys that have the ability to clear 40 homers.
Tip #2: Take Advantage of Correlation
In some league setups, you can often kill two birds with one stone by knowing how the categories correlate with each other. Here is the correlation matrix for offensive production from 2014-2019:

If you aren't familiar with correlation, it's pretty simple. The correlation between two variables is a measure of how related they are to each other. A correlation coefficient value of 1 is a perfect positive correlation, meaning as one variable goes up, the other will go up at the same rate. Anything with a value of -1 is a perfect negative correlation, meaning as one goes up the other goes down at the same rate.
What we see above is a very strong correlation between home runs and RBI of .85. Makes sense, right? If you hit a bunch of home runs, odds are you drove in a bunch of runs as well. There is also a strong correlation between home runs and slugging percentage, as well as between batting average on on-base percentage.
This is mostly useful in leagues that don't use the five standard categories. For example, if your league has slugging percentage as a sixth offensive category, it would be wise of you to make sure your team is the projected leader in home runs after the draft is completed because the correlation between homers and slugging percentage makes those categories almost doubly as valuable. You can let other people chase the runs scored position and you just keep piling up guys that will be elite in homers and slugging percentage, because it's very rare that someone contributing in one of those categories won't be in the other.
The same goes for leagues with batting average and on-base percentage, you should put extra weight on the high batting average guys because they will most likely boost you in on-base percentage as well. If you are last in the league in batting average, you are almost surely in the bottom three in on-base percentage too which makes it really tough to win a league.
Tip #3 - Know The Specialists
A one-category player typically will hurt your team more than help it in a categories league, therefore they will typically plummet in categories drafts. Two examples of these types of players would be Kyle Schwarber (tons of homers, not much of anything else) and David Fletcher (elite batting average, almost literally nothing else). By themselves, they don't really make your fantasy team that much better. Put them on the same team, however, and all of a sudden you have two roster slots combining for 44 homers and a .271 batting average (Gleyber Torres hit 38 homers with a .278 batting average for comparison). It costs an extra roster slot to make that Torres-type player, but you do end up grabbing a strong amount of across-the-board production using two very inexpensive draft picks.
It is so important to monitor your team's projections as the draft goes on. While projections are only so useful given how hard it is to predict the future, the one thing they are good at is bringing your attention to strengths and weaknesses. If your team is projecting last in the league in batting average in round 18 because you took a bunch of steals and homer guys early, you can really make up ground with the Fletcher / Nick Madrigal types in the late rounds.
A player's value is different for different team builds. If you already have Trea Turner and Adalberto Mondesi, then Jonathan Villar doesn't provide much utility to you. However, if you have no players projected above 10 steals and you're in the final rounds of the draft, a guy like Jon Berti could be a really smart pick.
Download Our Free News & Alerts Mobile App
Like what you see? Download our updated fantasy baseball app for iPhone and Android with 24x7 player news, injury alerts, sleepers, prospects & more. All free!

More 2021 Fantasy Baseball Advice
 RADIO
RADIO


