I guess the talk will never change. "Running backs don't matter." Sure. The thing is, Christian McCaffrey is still up there at the top of the fantasy points per game leaderboard. And do you know the position CMC is slotted at? The next non-quarterback on that list is Dalvin Cook, who happens to be another running back. We're past Week 9 already and entering the stretch of the season in which you will be fighting harder than ever to procure that sweet playoff spot. And knowing the importance of having solid rushers in your lineups, it's only right we highlight them in this week's column.
To gain the biggest edge in your fantasy football league, it's necessary to understand how to apply the advanced statistics being used in sports nowadays. Back in the day, it was all about wins and losses, passing yards, and touchdowns scored. It's not that those stats are now worthless, they just don't offer enough information to savvy analysts. While football is still in its infancy compared to baseball in terms of analytics, the evolution the sport has seen lately in those terms is notable.
Each week, I'll be tackling NFL's Next Gen Stats, bringing you data from the just-completed week's games with notable takeaways you should consider when assessing fantasy players for the upcoming week. In case you're new to the series, or Next Gen Stats altogether, I recommend you read our preseason primer. Now, let's get to the data!
Editor's Note: Our incredible team of writers received five total writing awards and 13 award nominations by the Fantasy Sports Writers Association, tops in the industry! Congrats to all the award winners and nominees including Best NFL Series, MLB Series, NBA Writer, PGA Writer and Player Notes writer of the year. Be sure to follow their analysis, rankings and advice all year long, and win big with RotoBaller! Read More!
Mid-Season Rundown of Rushers - NextGenStats
In the past three weeks, I have tackled NextGenStats data from a completely objective perspective, trying to identify the relationship between each of the metrics provided by the NFL and how they impact fantasy points for each player. You can read my initial synopses about running backs, quarterbacks, and wide receivers/tight ends in these links.
This week I'll provide updates on how the league's rushers are doing in the different metrics we've already tackled. Only this time I'll be limiting the scope to focus on their fantasy production as pure rushers, eliminating the pass-catching element. This will concentrate entirely on their total rushing yardage and rushing touchdowns.
So let's dive into each available metric and look at some interesting insights from the leaders and trailers of each category. Note: The cutoff is set at 45 rushing attempts.
Efficiency
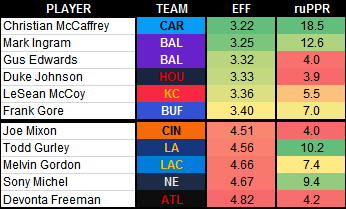
Correlation with Rushing PPR: negative-19%
Leaders and Trailers:

Leaderboard Notes:
- Gus Edwards and Mark Ingram have very similar profiles, but the former is way too limited in opportunities to match Ingram's numbers. If Ingram gets injured, though, Edwards could slide into similar production.
- LeSean McCoy (3.36) and Damien Williams (4.22) have very different EFF profiles, but they are averaging 5.5 and 5.8 rushing PPR this season, respectively. McCoy would be the better player had Williams not scored an extra-TD.
- Just to highlight how volatile EFF is, Arizona has three qualified players with very different EFF values, and their respective rushing PPR is all around the place: Kenyan Drake (3.66 EFF, 4.9 PPR), Chase Edmonds (3.83, 6.7), and David Johnson (4.01, 6.0).
Fantasy Takeaways:
- An "efficient" running back is that with a low EFF number, which means he is a north-south rusher that doesn't "waste" yards moving laterally.
- This metric correlates to 32% with TLOS: Obviously, when a running back goes north-south he doesn't have much time to spend before crossing the offensive line.
- This metric correlates to negative-29% with YDS: The more efficient the running back, the more yardage he tends to gain. The relationship isn't overwhelming, but there is indeed something to it.
- This metric correlates to negative-72% with Y/A: Again, if a running back is efficient that means he gains more yards on average and that ultimately translates to more yards per attempt. There is some real correlation here, so keep it in mind when scouting players.
Percentage of Stacked Boxes Faced
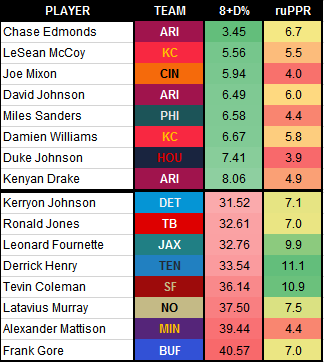
Correlation with Rushing PPR: 14%
Leaders and Trailers:

Leaderboard Notes:
- After rushing more than 100 times, Joe Mixon is still not facing stacked boxes. He's simply not inflicting fear into defenses and is the only rusher with 100-plus carries and an under-10% 8+D%.
- Nick Chubb is the clear No. 1 running back with the lowest 8+D% of the league at 11.04%. Next on the list is Marlon Mack at 13.84%. The rest of running backs not playing in a timeshare face stacked boxes in 15% or more of their tries.
Fantasy Takeaways:
- A "stacked box" is that in which there are eight or more defenders in front of the rusher.
- This metric correlates to negative-31% with TLOS: Rushers that face more stacked boxes are those who take less time to cross the LOS. Be careful with this, as it might seem counterintuitive at first sight.
- This metric correlates to 21% with ATT: There is not much to this relationship, but it makes sense. Rushers with a heavier workload see a greater percentage of stacked boxes since they're the lead backs on their team, and defenses are more likely commit extra men to stopping them.
Average Time Behind The Line Of Scrimmage
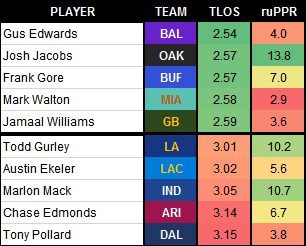
Correlation with Rushing PPR: 11%
Leaders and Trailers:

Leaderboard Notes:
- The Bills (Frank Gore) and the Raiders (Josh Jacobs) feature the rushers spending the least time behind the LOS at 2.57 seconds each. On the other side of the spectrum, Indianapolis (Marlon Mack, 3.05) and Los Angeles Rams (Todd Gurley, 3.01) have the "slowest" backs.
- As you can see in the table, a relationship of 11% with rushing PPR means nothing. Josh Jacobs and Frank Gore have the same profile but are separated by almost seven fantasy points. Something similar (but reversed) happens between Todd Gurley and Austin Ekeler.
Fantasy Takeaways:
- This metric correlates to 16% with Y/A: This relationship is virtually non-existent, though you could stretch to say patient rushers tend to find better holes to exploit and ultimately end with more yards.
ATT & YDS & Y/A
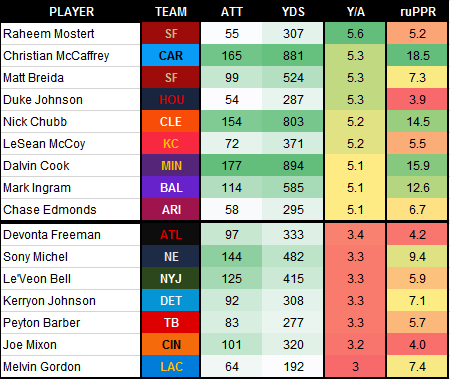
Correlation with Rushing PPR: 80% / 85% / 31%
Leaders and Trailers:

Leaderboard Notes:
- I have sorted the data by Y/A to showcase how volatile that metric is. You can see how there are some talented bell cows at the top (Christian McCaffrey, Nick Chubb, Dalvin Cook), but also some with much lighter workloads (Raheem Mostert, Duke Johnson, Chase Edmons). This shows a problem with Y/A as running backs tend to regress as a whole with larger workloads.
- Every player with more than 125 attempts this season is averaging at least 9.4 rushing PPR points per game.
- Every player with more than 525 rushing yards this season is averaging at least 9.8 rushing PPR points per game.
- Only three players (Tevin Coleman, Todd Gurley, James Conner) are averaging more than 9 rushing PPR points per game having carried the ball fewer than 100 times.
- Only two players (Tevin Coleman, Todd Gurley) are averaging more than 9 rushing PPR points per game having rushed for fewer than 400 yards.
Fantasy Takeaways:
- As the fantasy gospel says, volume is key and with volume comes production. That explains why players with the most attempts and yards are those putting on the best rushing performances.
- Yards per attempt don't matter that much, though, as anyone can average 10 Y/A if he has carried the ball just once. In the long run, it's not very meaningful.
A Quick Note On Touchdowns:
- Obviously, touchdowns correlate the most with rushing points per game (86%), as each of them accounts for six PPR points alone. More touchdowns = more points, obviously.
- Touchdowns are highly volatile, though, and widely unpredictable.
- For example, three players (Tevin Coleman, Phillip Lindsay, David Montgomery) have scored five touchdowns so far. But they have done so carrying the ball 83, 118, and 112 times for 355, 584 and 406 yards. Call me when you find any sort of explanation for those random numbers.
- On the other hand, Leonard Fournette's season is surely an unlucky one. Fournette has rushed the ball 174 times for 831 yards on the ground and has scored just one TD. Chris Carson, Dalvin Cook, and Christian McCaffrey have either more attempts or more yardage, and they have scored three, nine, and 10, respectively.
- Don't focus on rushing touchdowns when scouting running backs. In fact, try to get players producing high numbers without scoring, as they could only positively regress in the future.
That's it for today. Until we meet again next week, don't get too mad at the bye weeks, try to find the best free agents on your leagues' player pools, field the most productive teams you can, and win the weekend with all of your squads!
 RADIO
RADIO


